[Sextan] Hull MA BacktestLevel: 1
NOTE: This is a request by @babaa to backtest Hull suite by InSilico with my Sextan framework. You can backtest many of my indicators in minutes now! Of course,you can define your own indicator in the highlighted area in compliance with the uniform format, which guarantee when you use "Indicator on Indicator" function, it would not produce any error.
Courtesy of InSilico for his Hull suite indicator
Background
Backtesting of technical indicators and strategies is the most common way to understand a quantitative strategy. However, the complicated configuration and adaptation work of backtesting many quantitative tools makes many traders who do not understand the code daunted. Moreover, although I have written a lot of strategies, I am still not very satisfied with the backtest configuration and writing efficiency. Therefore, I have been thinking about how to build a backtesting framework that can quickly and easily evaluate the backtesting performance of any indicator with a "long/short entry" indicator, that is, a "simple backtesting tool for dummies". The performance requirements should be stable, and the operation should be simple and convenient. It is best to "copy", "paste", and "a few mouse clicks" to complete the quick backtest and evaluation of a new indicator.
Luckily, I recently realized that TradingView provides an "Indicator on Indicator" feature, which is the perfect foundation for doing "hot swap" backtesting. My basic idea is to use a two-layer design. The first layer is the technical indicator signal source that needs to be embedded, which is only used to provide buy and sell signals of custom strategies; the second layer is the trading system, which is used to receive the output signals of the first layer, and filter the signals according to the agreed specifications. , Take Profit, Stop Loss, draw buy and sell signals and cost lines, define and send custom buy and sell alert messages to mobile phones, social software or trading interfaces. In general, this two-layer design is a flexible combination of "death and alive", which can meet the needs of most traders to quickly evaluate the performance of a certain technical indicator. The first layer here is flexible. Users can insert their own strategy codes according to my template, and they can draw buy and sell signals and output them to the second layer. The second layer is fixed, and the overall framework is solidified to ensure the stability and unity of the trading system. It is convenient to compare different or similar strategies under the same conditions. Finally, all trading signals are drawn on the chart, and the output strategy returns. test report.
The main function:
The first layer: "{Sextan} Your Indicator Source", the script provides a template for personalized strategy input, and the signal and definition interfaces ensure full compatibility with the second layer. Backtesting is performed stably in the backtesting framework of the layer. The first layer of this script is also relatively simple: enter your script in the highlighted custom script area, and after ensuring the final buy and sell signals long = bool condition, short = bool condition, the design of the first layer is considered complete. Input it into the PINE script editor of TradingView, save it and add it to the chart, you can see the pulse sequence in yellow (buy) and purple (sell) on the sub-picture, corresponding to the main picture, you can subjectively judge that the quality of the trading point of the strategy is good Bad.
The second layer: "{Sextan} PINEv4 Sextans Backtest Framework". This script is the standardized trading system strategy execution and alarm, used to generate the final report of the strategy backtest and some key indicators that I have customized that I find useful, such as: winning rate , Odds, Winning Surface, Kelly Ratio, Take Profit and Stop Loss Thresholds, Trading Frequency, etc. are evaluated according to the Kelly formula. To use the second layer, first load it into the TrainingView chart, no markers will appear on the chart, since you have not specified any strategy source signals, click on the gear-shaped setting next to the "{Sextan} PINEv4 Sextans BTFW" header button, you can open the backtest settings, the first item is to select your custom strategy source. Because we have added the strategy source to the chart in the previous step, you can easily find an option "{Sextan} Your Indicator Source: Signal" at the bottom of the list, this is the strategy source input we need, select and confirm , you can see various markers on the main graph, and quickly generate a backtesting profit graph and a list of backtesting reports. You can generate files and download the backtesting reports locally. You can also click the gear on the backtest chart interface to customize some conditions of the backtest, including: initial capital amount, currency type, percentage of each order placed, amount of pyramid additions, commission fees, slippage, etc. configuration. Note: The configuration in the interface dialog overrides the same configuration implemented by the code in the backtest script.
How to output charts:
The first layer: "{Sextan} Your Indicator Source", the output of this script is the pulse value of yellow and purple, yellow +1 means buy, purple -1 means sell.
The second layer: PINEv4 Sextans Backtest Framework". The output of this script is a bit complicated. After all, it is the entire trading system with a lot of information:
1. Blue and red arrows. The blue upward arrow indicates long position, the red downward arrow indicates short position, and the horizontal bar at the end of the purple arrow indicates take profit or stop loss exit.
2. Red and green lines. This is the holding cost line of the strategy, green represents the cost of holding a long position, and red represents the cost of holding a short position. The cost line is a continuous solid line and the price action is relatively close.
3. Green and yellow long take profit and stop loss area and green and yellow long take profit and stop loss fork. Once a long position is held, there is a conditional order for take profit and stop loss. The green horizontal line is the long take profit ratio line, and the yellow is the long stop loss ratio line; the green cross indicates the long take profit price, and the yellow cross indicates the long position. Stop loss price. It's worth noting that the prongs and wires don't necessarily go together. Because of the optimization of the algorithm, for a strong market, the take profit will occur after breaking the take profit line, and the profit will not be taken until the price falls.
4. The purple and red short take profit and stop loss area and the purple red short stop loss fork. Once a short position is held, there will be a take profit and stop loss conditional order, the red is the short take profit ratio line, and the purple is the short stop loss ratio line; the red cross indicates the short take profit price, and the purple cross indicates the short stop loss price.
5. In addition to the above signs, there are also text and numbers indicating the profit and loss values of long and short positions. "L" means long; "S" means short; "XL" means close long; "XS" means close short.
TradingView Strategy Tester Panel:
The overview graph is an intuitive graph that plots the blue (gain) and red (loss) curves of all backtest periods together, and notes: the absolute value and percentage of net profit, the number of all closed positions, the winning percentage, the profit factor, The maximum trading loss, the absolute value and ratio of the average trading profit and loss, and the average number of K-lines held in all trades.
Another is the performance summary. This is to display all long and short statistical indicators of backtesting in the form of a list, such as: net profit, gross profit, Sharpe ratio, maximum position, commission, times of profit and loss, etc.
Finally, the transaction list is a table indexed by the transaction serial number, showing the signal direction, date and time, price, profit and loss, accumulated profit and loss, maximum transaction profit, transaction loss and other values.
Remarks
Finally, I will explain that this is just the beginning of this model. I will continue to optimize the trading system of the second layer. Various optimization feedback and suggestions are welcome. For valuable feedback, I am willing to provide some L4/L5 technical indicators as rewards for free subscription rights.
在腳本中搜尋"stop loss"

[Sextan] Fisher Transform BacktestLevel: 1
NOTE: This is a request by @Uni_ve12se to backtest Ehlers Fisher Transform by cheatcountry with my Sextan framework. I ONLY take 5 minutes to perform it and how much time would you cost for this work? You can backtest many of my indicators in minutes now! Of course,you can define your own indicator in the highlighted area in compliance with the uniform format, which guarantee when you use "Indicator on Indicator" function, it would not produce any error.
Courtesy of cheatcountry for his Ehlers Fisher Transform indicator
Background
Backtesting of technical indicators and strategies is the most common way to understand a quantitative strategy. However, the complicated configuration and adaptation work of backtesting many quantitative tools makes many traders who do not understand the code daunted. Moreover, although I have written a lot of strategies, I am still not very satisfied with the backtest configuration and writing efficiency. Therefore, I have been thinking about how to build a backtesting framework that can quickly and easily evaluate the backtesting performance of any indicator with a "long/short entry" indicator, that is, a "simple backtesting tool for dummies". The performance requirements should be stable, and the operation should be simple and convenient. It is best to "copy", "paste", and "a few mouse clicks" to complete the quick backtest and evaluation of a new indicator.
Luckily, I recently realized that TradingView provides an "Indicator on Indicator" feature, which is the perfect foundation for doing "hot swap" backtesting. My basic idea is to use a two-layer design. The first layer is the technical indicator signal source that needs to be embedded, which is only used to provide buy and sell signals of custom strategies; the second layer is the trading system, which is used to receive the output signals of the first layer, and filter the signals according to the agreed specifications. , Take Profit, Stop Loss, draw buy and sell signals and cost lines, define and send custom buy and sell alert messages to mobile phones, social software or trading interfaces. In general, this two-layer design is a flexible combination of "death and alive", which can meet the needs of most traders to quickly evaluate the performance of a certain technical indicator. The first layer here is flexible. Users can insert their own strategy codes according to my template, and they can draw buy and sell signals and output them to the second layer. The second layer is fixed, and the overall framework is solidified to ensure the stability and unity of the trading system. It is convenient to compare different or similar strategies under the same conditions. Finally, all trading signals are drawn on the chart, and the output strategy returns. test report.
The main function:
The first layer: "{Sextan} Your Indicator Source", the script provides a template for personalized strategy input, and the signal and definition interfaces ensure full compatibility with the second layer. Backtesting is performed stably in the backtesting framework of the layer. The first layer of this script is also relatively simple: enter your script in the highlighted custom script area, and after ensuring the final buy and sell signals long = bool condition, short = bool condition, the design of the first layer is considered complete. Input it into the PINE script editor of TradingView, save it and add it to the chart, you can see the pulse sequence in yellow (buy) and purple (sell) on the sub-picture, corresponding to the main picture, you can subjectively judge that the quality of the trading point of the strategy is good Bad.
The second layer: "{Sextan} PINEv4 Sextans Backtest Framework". This script is the standardized trading system strategy execution and alarm, used to generate the final report of the strategy backtest and some key indicators that I have customized that I find useful, such as: winning rate , Odds, Winning Surface, Kelly Ratio, Take Profit and Stop Loss Thresholds, Trading Frequency, etc. are evaluated according to the Kelly formula. To use the second layer, first load it into the TrainingView chart, no markers will appear on the chart, since you have not specified any strategy source signals, click on the gear-shaped setting next to the "{Sextan} PINEv4 Sextans BTFW" header button, you can open the backtest settings, the first item is to select your custom strategy source. Because we have added the strategy source to the chart in the previous step, you can easily find an option "{Sextan} Your Indicator Source: Signal" at the bottom of the list, this is the strategy source input we need, select and confirm , you can see various markers on the main graph, and quickly generate a backtesting profit graph and a list of backtesting reports. You can generate files and download the backtesting reports locally. You can also click the gear on the backtest chart interface to customize some conditions of the backtest, including: initial capital amount, currency type, percentage of each order placed, amount of pyramid additions, commission fees, slippage, etc. configuration. Note: The configuration in the interface dialog overrides the same configuration implemented by the code in the backtest script.
How to output charts:
The first layer: "{Sextan} Your Indicator Source", the output of this script is the pulse value of yellow and purple, yellow +1 means buy, purple -1 means sell.
The second layer: PINEv4 Sextans Backtest Framework". The output of this script is a bit complicated. After all, it is the entire trading system with a lot of information:
1. Blue and red arrows. The blue upward arrow indicates long position, the red downward arrow indicates short position, and the horizontal bar at the end of the purple arrow indicates take profit or stop loss exit.
2. Red and green lines. This is the holding cost line of the strategy, green represents the cost of holding a long position, and red represents the cost of holding a short position. The cost line is a continuous solid line and the price action is relatively close.
3. Green and yellow long take profit and stop loss area and green and yellow long take profit and stop loss fork. Once a long position is held, there is a conditional order for take profit and stop loss. The green horizontal line is the long take profit ratio line, and the yellow is the long stop loss ratio line; the green cross indicates the long take profit price, and the yellow cross indicates the long position. Stop loss price. It's worth noting that the prongs and wires don't necessarily go together. Because of the optimization of the algorithm, for a strong market, the take profit will occur after breaking the take profit line, and the profit will not be taken until the price falls.
4. The purple and red short take profit and stop loss area and the purple red short stop loss fork. Once a short position is held, there will be a take profit and stop loss conditional order, the red is the short take profit ratio line, and the purple is the short stop loss ratio line; the red cross indicates the short take profit price, and the purple cross indicates the short stop loss price.
5. In addition to the above signs, there are also text and numbers indicating the profit and loss values of long and short positions. "L" means long; "S" means short; "XL" means close long; "XS" means close short.
TradingView Strategy Tester Panel:
The overview graph is an intuitive graph that plots the blue (gain) and red (loss) curves of all backtest periods together, and notes: the absolute value and percentage of net profit, the number of all closed positions, the winning percentage, the profit factor, The maximum trading loss, the absolute value and ratio of the average trading profit and loss, and the average number of K-lines held in all trades.
Another is the performance summary. This is to display all long and short statistical indicators of backtesting in the form of a list, such as: net profit, gross profit, Sharpe ratio, maximum position, commission, times of profit and loss, etc.
Finally, the transaction list is a table indexed by the transaction serial number, showing the signal direction, date and time, price, profit and loss, accumulated profit and loss, maximum transaction profit, transaction loss and other values.
Remarks
Finally, I will explain that this is just the beginning of this model. I will continue to optimize the trading system of the second layer. Various optimization feedback and suggestions are welcome. For valuable feedback, I am willing to provide some L4/L5 technical indicators as rewards for free subscription rights.

[Sextan] M-Oscillator BacktestLevel: 1
NOTE: This is a request by @scantor516 to backtest M-Oscillator by Mango2Juice with my Sextan framework. I ONLY take 5 minutes to perform it and how much time would you cost for this work?
Courtesy of Mango2Juice for M-Oscillator script.
You can backtest many of my indicators in minutes now! Of course,you can define your own indicator in the highlighted area in compliance with the uniform format, which guarantee when you use "Indicator on Indicator" function, it would not produce any error.
Background
Backtesting of technical indicators and strategies is the most common way to understand a quantitative strategy. However, the complicated configuration and adaptation work of backtesting many quantitative tools makes many traders who do not understand the code daunted. Moreover, although I have written a lot of strategies, I am still not very satisfied with the backtest configuration and writing efficiency. Therefore, I have been thinking about how to build a backtesting framework that can quickly and easily evaluate the backtesting performance of any indicator with a "long/short entry" indicator, that is, a "simple backtesting tool for dummies". The performance requirements should be stable, and the operation should be simple and convenient. It is best to "copy", "paste", and "a few mouse clicks" to complete the quick backtest and evaluation of a new indicator.
Luckily, I recently realized that TradingView provides an "Indicator on Indicator" feature, which is the perfect foundation for doing "hot swap" backtesting. My basic idea is to use a two-layer design. The first layer is the technical indicator signal source that needs to be embedded, which is only used to provide buy and sell signals of custom strategies; the second layer is the trading system, which is used to receive the output signals of the first layer, and filter the signals according to the agreed specifications. , Take Profit, Stop Loss, draw buy and sell signals and cost lines, define and send custom buy and sell alert messages to mobile phones, social software or trading interfaces. In general, this two-layer design is a flexible combination of "death and alive", which can meet the needs of most traders to quickly evaluate the performance of a certain technical indicator. The first layer here is flexible. Users can insert their own strategy codes according to my template, and they can draw buy and sell signals and output them to the second layer. The second layer is fixed, and the overall framework is solidified to ensure the stability and unity of the trading system. It is convenient to compare different or similar strategies under the same conditions. Finally, all trading signals are drawn on the chart, and the output strategy returns. test report.
The main function:
The first layer: "{Sextan} Your Indicator Source", the script provides a template for personalized strategy input, and the signal and definition interfaces ensure full compatibility with the second layer. Backtesting is performed stably in the backtesting framework of the layer. The first layer of this script is also relatively simple: enter your script in the highlighted custom script area, and after ensuring the final buy and sell signals long = bool condition, short = bool condition, the design of the first layer is considered complete. Input it into the PINE script editor of TradingView, save it and add it to the chart, you can see the pulse sequence in yellow (buy) and purple (sell) on the sub-picture, corresponding to the main picture, you can subjectively judge that the quality of the trading point of the strategy is good Bad.
The second layer: "{Sextan} PINEv4 Sextans Backtest Framework". This script is the standardized trading system strategy execution and alarm, used to generate the final report of the strategy backtest and some key indicators that I have customized that I find useful, such as: winning rate , Odds, Winning Surface, Kelly Ratio, Take Profit and Stop Loss Thresholds, Trading Frequency, etc. are evaluated according to the Kelly formula. To use the second layer, first load it into the TrainingView chart, no markers will appear on the chart, since you have not specified any strategy source signals, click on the gear-shaped setting next to the "{Sextan} PINEv4 Sextans BTFW" header button, you can open the backtest settings, the first item is to select your custom strategy source. Because we have added the strategy source to the chart in the previous step, you can easily find an option "{Sextan} Your Indicator Source: Signal" at the bottom of the list, this is the strategy source input we need, select and confirm , you can see various markers on the main graph, and quickly generate a backtesting profit graph and a list of backtesting reports. You can generate files and download the backtesting reports locally. You can also click the gear on the backtest chart interface to customize some conditions of the backtest, including: initial capital amount, currency type, percentage of each order placed, amount of pyramid additions, commission fees, slippage, etc. configuration. Note: The configuration in the interface dialog overrides the same configuration implemented by the code in the backtest script.
How to output charts:
The first layer: "{Sextan} Your Indicator Source", the output of this script is the pulse value of yellow and purple, yellow +1 means buy, purple -1 means sell.
The second layer: PINEv4 Sextans Backtest Framework". The output of this script is a bit complicated. After all, it is the entire trading system with a lot of information:
1. Blue and red arrows. The blue upward arrow indicates long position, the red downward arrow indicates short position, and the horizontal bar at the end of the purple arrow indicates take profit or stop loss exit.
2. Red and green lines. This is the holding cost line of the strategy, green represents the cost of holding a long position, and red represents the cost of holding a short position. The cost line is a continuous solid line and the price action is relatively close.
3. Green and yellow long take profit and stop loss area and green and yellow long take profit and stop loss fork. Once a long position is held, there is a conditional order for take profit and stop loss. The green horizontal line is the long take profit ratio line, and the yellow is the long stop loss ratio line; the green cross indicates the long take profit price, and the yellow cross indicates the long position. Stop loss price. It's worth noting that the prongs and wires don't necessarily go together. Because of the optimization of the algorithm, for a strong market, the take profit will occur after breaking the take profit line, and the profit will not be taken until the price falls.
4. The purple and red short take profit and stop loss area and the purple red short stop loss fork. Once a short position is held, there will be a take profit and stop loss conditional order, the red is the short take profit ratio line, and the purple is the short stop loss ratio line; the red cross indicates the short take profit price, and the purple cross indicates the short stop loss price.
5. In addition to the above signs, there are also text and numbers indicating the profit and loss values of long and short positions. "L" means long; "S" means short; "XL" means close long; "XS" means close short.
TradingView Strategy Tester Panel:
The overview graph is an intuitive graph that plots the blue (gain) and red (loss) curves of all backtest periods together, and notes: the absolute value and percentage of net profit, the number of all closed positions, the winning percentage, the profit factor, The maximum trading loss, the absolute value and ratio of the average trading profit and loss, and the average number of K-lines held in all trades.
Another is the performance summary. This is to display all long and short statistical indicators of backtesting in the form of a list, such as: net profit, gross profit, Sharpe ratio, maximum position, commission, times of profit and loss, etc.
Finally, the transaction list is a table indexed by the transaction serial number, showing the signal direction, date and time, price, profit and loss, accumulated profit and loss, maximum transaction profit, transaction loss and other values.
Remarks
Finally, I will explain that this is just the beginning of this model. I will continue to optimize the trading system of the second layer. Various optimization feedback and suggestions are welcome. For valuable feedback, I am willing to provide some L4/L5 technical indicators as rewards for free subscription rights.

[Sextan] KAMA BacktestLevel: 1
NOTE: This is ONLY an EXAMPLE on HOW-TO produce a customized "{Sextan} PINEv4 Sextans Backtest Framework" with intput signal source as my "{blackcat} L2 Perry Kaufman Adaptive MA (KAMA)" quickly and drawing on main chart. You can backtest many of my indicators in minutes now!
Of course,you can define your own indicator in the highlighted area in compliance with the uniform format, which guarantee when you use "Indicator on Indicator" function, it would not produce any error.
Background
Backtesting of technical indicators and strategies is the most common way to understand a quantitative strategy. However, the complicated configuration and adaptation work of backtesting many quantitative tools makes many traders who do not understand the code daunted. Moreover, although I have written a lot of strategies, I am still not very satisfied with the backtest configuration and writing efficiency. Therefore, I have been thinking about how to build a backtesting framework that can quickly and easily evaluate the backtesting performance of any indicator with a "long/short entry" indicator, that is, a "simple backtesting tool for dummies". The performance requirements should be stable, and the operation should be simple and convenient. It is best to "copy", "paste", and "a few mouse clicks" to complete the quick backtest and evaluation of a new indicator.
Luckily, I recently realized that TradingView provides an "Indicator on Indicator" feature, which is the perfect foundation for doing "hot swap" backtesting. My basic idea is to use a two-layer design. The first layer is the technical indicator signal source that needs to be embedded, which is only used to provide buy and sell signals of custom strategies; the second layer is the trading system, which is used to receive the output signals of the first layer, and filter the signals according to the agreed specifications. , Take Profit, Stop Loss, draw buy and sell signals and cost lines, define and send custom buy and sell alert messages to mobile phones, social software or trading interfaces. In general, this two-layer design is a flexible combination of "death and alive", which can meet the needs of most traders to quickly evaluate the performance of a certain technical indicator. The first layer here is flexible. Users can insert their own strategy codes according to my template, and they can draw buy and sell signals and output them to the second layer. The second layer is fixed, and the overall framework is solidified to ensure the stability and unity of the trading system. It is convenient to compare different or similar strategies under the same conditions. Finally, all trading signals are drawn on the chart, and the output strategy returns. test report.
The main function:
The first layer: "{Sextan} Your Indicator Source", the script provides a template for personalized strategy input, and the signal and definition interfaces ensure full compatibility with the second layer. Backtesting is performed stably in the backtesting framework of the layer. The first layer of this script is also relatively simple: enter your script in the highlighted custom script area, and after ensuring the final buy and sell signals long = bool condition, short = bool condition, the design of the first layer is considered complete. Input it into the PINE script editor of TradingView, save it and add it to the chart, you can see the pulse sequence in yellow (buy) and purple (sell) on the sub-picture, corresponding to the main picture, you can subjectively judge that the quality of the trading point of the strategy is good Bad.
The second layer: "{Sextan} PINEv4 Sextans Backtest Framework". This script is the standardized trading system strategy execution and alarm, used to generate the final report of the strategy backtest and some key indicators that I have customized that I find useful, such as: winning rate , Odds, Winning Surface, Kelly Ratio, Take Profit and Stop Loss Thresholds, Trading Frequency, etc. are evaluated according to the Kelly formula. To use the second layer, first load it into the TrainingView chart, no markers will appear on the chart, since you have not specified any strategy source signals, click on the gear-shaped setting next to the "{Sextan} PINEv4 Sextans BTFW" header button, you can open the backtest settings, the first item is to select your custom strategy source. Because we have added the strategy source to the chart in the previous step, you can easily find an option "{Sextan} Your Indicator Source: Signal" at the bottom of the list, this is the strategy source input we need, select and confirm , you can see various markers on the main graph, and quickly generate a backtesting profit graph and a list of backtesting reports. You can generate files and download the backtesting reports locally. You can also click the gear on the backtest chart interface to customize some conditions of the backtest, including: initial capital amount, currency type, percentage of each order placed, amount of pyramid additions, commission fees, slippage, etc. configuration. Note: The configuration in the interface dialog overrides the same configuration implemented by the code in the backtest script.
How to output charts:
The first layer: "{Sextan} Your Indicator Source", the output of this script is the pulse value of yellow and purple, yellow +1 means buy, purple -1 means sell.
The second layer: PINEv4 Sextans Backtest Framework". The output of this script is a bit complicated. After all, it is the entire trading system with a lot of information:
1. Blue and red arrows. The blue upward arrow indicates long position, the red downward arrow indicates short position, and the horizontal bar at the end of the purple arrow indicates take profit or stop loss exit.
2. Red and green lines. This is the holding cost line of the strategy, green represents the cost of holding a long position, and red represents the cost of holding a short position. The cost line is a continuous solid line and the price action is relatively close.
3. Green and yellow long take profit and stop loss area and green and yellow long take profit and stop loss fork. Once a long position is held, there is a conditional order for take profit and stop loss. The green horizontal line is the long take profit ratio line, and the yellow is the long stop loss ratio line; the green cross indicates the long take profit price, and the yellow cross indicates the long position. Stop loss price. It's worth noting that the prongs and wires don't necessarily go together. Because of the optimization of the algorithm, for a strong market, the take profit will occur after breaking the take profit line, and the profit will not be taken until the price falls.
4. The purple and red short take profit and stop loss area and the purple red short stop loss fork. Once a short position is held, there will be a take profit and stop loss conditional order, the red is the short take profit ratio line, and the purple is the short stop loss ratio line; the red cross indicates the short take profit price, and the purple cross indicates the short stop loss price.
5. In addition to the above signs, there are also text and numbers indicating the profit and loss values of long and short positions. "L" means long; "S" means short; "XL" means close long; "XS" means close short.
TradingView Strategy Tester Panel:
The overview graph is an intuitive graph that plots the blue (gain) and red (loss) curves of all backtest periods together, and notes: the absolute value and percentage of net profit, the number of all closed positions, the winning percentage, the profit factor, The maximum trading loss, the absolute value and ratio of the average trading profit and loss, and the average number of K-lines held in all trades.
Another is the performance summary. This is to display all long and short statistical indicators of backtesting in the form of a list, such as: net profit, gross profit, Sharpe ratio, maximum position, commission, times of profit and loss, etc.
Finally, the transaction list is a table indexed by the transaction serial number, showing the signal direction, date and time, price, profit and loss, accumulated profit and loss, maximum transaction profit, transaction loss and other values.
Remarks
Finally, I will explain that this is just the beginning of this model. I will continue to optimize the trading system of the second layer. Various optimization feedback and suggestions are welcome. For valuable feedback, I am willing to provide some L4/L5 technical indicators as rewards for free subscription rights.

[Sextan] Backtesting with L2 Reversal Labels as an input sourceLevel: 1
NOTE: This is ONLY an EXAMPLE on HOW-TO produce a customized "{Sextan} PINEv4 Sextans Backtest Framework" intput signal with "(blackcat) L2 Reversal Labels", and you can define your own indicator in the highlighted area in compliance with the uniform format, which guarantee when you use "Indicator on Indicator" function, it would not produce any error.
I use two simple moving average crossings to produce long and short entry signal with SMA3 and SMA8 in the example.
Background
Backtesting of technical indicators and strategies is the most common way to understand a quantitative strategy. However, the complicated configuration and adaptation work of backtesting many quantitative tools makes many traders who do not understand the code daunted. Moreover, although I have written a lot of strategies, I am still not very satisfied with the backtest configuration and writing efficiency. Therefore, I have been thinking about how to build a backtesting framework that can quickly and easily evaluate the backtesting performance of any indicator with a "long/short entry" indicator, that is, a "simple backtesting tool for dummies". The performance requirements should be stable, and the operation should be simple and convenient. It is best to "copy", "paste", and "a few mouse clicks" to complete the quick backtest and evaluation of a new indicator.
Luckily, I recently realized that TradingView provides an "Indicator on Indicator" feature, which is the perfect foundation for doing "hot swap" backtesting. My basic idea is to use a two-layer design. The first layer is the technical indicator signal source that needs to be embedded, which is only used to provide buy and sell signals of custom strategies; the second layer is the trading system, which is used to receive the output signals of the first layer, and filter the signals according to the agreed specifications. , Take Profit, Stop Loss, draw buy and sell signals and cost lines, define and send custom buy and sell alert messages to mobile phones, social software or trading interfaces. In general, this two-layer design is a flexible combination of "death and alive", which can meet the needs of most traders to quickly evaluate the performance of a certain technical indicator. The first layer here is flexible. Users can insert their own strategy codes according to my template, and they can draw buy and sell signals and output them to the second layer. The second layer is fixed, and the overall framework is solidified to ensure the stability and unity of the trading system. It is convenient to compare different or similar strategies under the same conditions. Finally, all trading signals are drawn on the chart, and the output strategy returns. test report.
The main function:
The first layer: "{Sextan} Your Indicator Source", the script provides a template for personalized strategy input, and the signal and definition interfaces ensure full compatibility with the second layer. Backtesting is performed stably in the backtesting framework of the layer. The first layer of this script is also relatively simple: enter your script in the highlighted custom script area, and after ensuring the final buy and sell signals long = bool condition, short = bool condition, the design of the first layer is considered complete. Input it into the PINE script editor of TradingView, save it and add it to the chart, you can see the pulse sequence in yellow (buy) and purple (sell) on the sub-picture, corresponding to the main picture, you can subjectively judge that the quality of the trading point of the strategy is good Bad.
The second layer: "{Sextan} PINEv4 Sextans Backtest Framework". This script is the standardized trading system strategy execution and alarm, used to generate the final report of the strategy backtest and some key indicators that I have customized that I find useful, such as: winning rate , Odds, Winning Surface, Kelly Ratio, Take Profit and Stop Loss Thresholds, Trading Frequency, etc. are evaluated according to the Kelly formula. To use the second layer, first load it into the TrainingView chart, no markers will appear on the chart, since you have not specified any strategy source signals, click on the gear-shaped setting next to the "{Sextan} PINEv4 Sextans BTFW" header button, you can open the backtest settings, the first item is to select your custom strategy source. Because we have added the strategy source to the chart in the previous step, you can easily find an option "{Sextan} Your Indicator Source: Signal" at the bottom of the list, this is the strategy source input we need, select and confirm , you can see various markers on the main graph, and quickly generate a backtesting profit graph and a list of backtesting reports. You can generate files and download the backtesting reports locally. You can also click the gear on the backtest chart interface to customize some conditions of the backtest, including: initial capital amount, currency type, percentage of each order placed, amount of pyramid additions, commission fees, slippage, etc. configuration. Note: The configuration in the interface dialog overrides the same configuration implemented by the code in the backtest script.
How to output charts:
The first layer: "{Sextan} Your Indicator Source", the output of this script is the pulse value of yellow and purple, yellow +1 means buy, purple -1 means sell.
The second layer: PINEv4 Sextans Backtest Framework". The output of this script is a bit complicated. After all, it is the entire trading system with a lot of information:
1. Blue and red arrows. The blue upward arrow indicates long position, the red downward arrow indicates short position, and the horizontal bar at the end of the purple arrow indicates take profit or stop loss exit.
2. Red and green lines. This is the holding cost line of the strategy, green represents the cost of holding a long position, and red represents the cost of holding a short position. The cost line is a continuous solid line and the price action is relatively close.
3. Green and yellow long take profit and stop loss area and green and yellow long take profit and stop loss fork. Once a long position is held, there is a conditional order for take profit and stop loss. The green horizontal line is the long take profit ratio line, and the yellow is the long stop loss ratio line; the green cross indicates the long take profit price, and the yellow cross indicates the long position. Stop loss price. It's worth noting that the prongs and wires don't necessarily go together. Because of the optimization of the algorithm, for a strong market, the take profit will occur after breaking the take profit line, and the profit will not be taken until the price falls.
4. The purple and red short take profit and stop loss area and the purple red short stop loss fork. Once a short position is held, there will be a take profit and stop loss conditional order, the red is the short take profit ratio line, and the purple is the short stop loss ratio line; the red cross indicates the short take profit price, and the purple cross indicates the short stop loss price.
5. In addition to the above signs, there are also text and numbers indicating the profit and loss values of long and short positions. "L" means long; "S" means short; "XL" means close long; "XS" means close short.
TradingView Strategy Tester Panel:
The overview graph is an intuitive graph that plots the blue (gain) and red (loss) curves of all backtest periods together, and notes: the absolute value and percentage of net profit, the number of all closed positions, the winning percentage, the profit factor, The maximum trading loss, the absolute value and ratio of the average trading profit and loss, and the average number of K-lines held in all trades.
Another is the performance summary. This is to display all long and short statistical indicators of backtesting in the form of a list, such as: net profit, gross profit, Sharpe ratio, maximum position, commission, times of profit and loss, etc.
Finally, the transaction list is a table indexed by the transaction serial number, showing the signal direction, date and time, price, profit and loss, accumulated profit and loss, maximum transaction profit, transaction loss and other values.
Remarks
Finally, I will explain that this is just the beginning of this model. I will continue to optimize the trading system of the second layer. Various optimization feedback and suggestions are welcome. For valuable feedback, I am willing to provide some L4/L5 technical indicators as rewards for free subscription rights.

[Sextan] Your Indicator SourceLevel: 1
NOTE: This is ONLY an EXAMPLE on HOW-TO produce a customized "{Sextan} PINEv4 Sextans Backtest Framework" intput signal source, you can define your own indicator in the highlighted area in compliance with the uniform format, which guarantee when you use "Indicator on Indicator" function, it would not produce any error.
I use two simple moving average crossings to produce long and short entry signal with SMA3 and SMA8 in the example.
Background
Backtesting of technical indicators and strategies is the most common way to understand a quantitative strategy. However, the complicated configuration and adaptation work of backtesting many quantitative tools makes many traders who do not understand the code daunted. Moreover, although I have written a lot of strategies, I am still not very satisfied with the backtest configuration and writing efficiency. Therefore, I have been thinking about how to build a backtesting framework that can quickly and easily evaluate the backtesting performance of any indicator with a "long/short entry" indicator, that is, a "simple backtesting tool for dummies". The performance requirements should be stable, and the operation should be simple and convenient. It is best to "copy", "paste", and "a few mouse clicks" to complete the quick backtest and evaluation of a new indicator.
Luckily, I recently realized that TradingView provides an "Indicator on Indicator" feature, which is the perfect foundation for doing "hot swap" backtesting. My basic idea is to use a two-layer design. The first layer is the technical indicator signal source that needs to be embedded, which is only used to provide buy and sell signals of custom strategies; the second layer is the trading system, which is used to receive the output signals of the first layer, and filter the signals according to the agreed specifications. , Take Profit, Stop Loss, draw buy and sell signals and cost lines, define and send custom buy and sell alert messages to mobile phones, social software or trading interfaces. In general, this two-layer design is a flexible combination of "death and alive", which can meet the needs of most traders to quickly evaluate the performance of a certain technical indicator. The first layer here is flexible. Users can insert their own strategy codes according to my template, and they can draw buy and sell signals and output them to the second layer. The second layer is fixed, and the overall framework is solidified to ensure the stability and unity of the trading system. It is convenient to compare different or similar strategies under the same conditions. Finally, all trading signals are drawn on the chart, and the output strategy returns. test report.
The main function:
The first layer: "{Sextan} Your Indicator Source", the script provides a template for personalized strategy input, and the signal and definition interfaces ensure full compatibility with the second layer. Backtesting is performed stably in the backtesting framework of the layer. The first layer of this script is also relatively simple: enter your script in the highlighted custom script area, and after ensuring the final buy and sell signals long = bool condition, short = bool condition, the design of the first layer is considered complete. Input it into the PINE script editor of TradingView, save it and add it to the chart, you can see the pulse sequence in yellow (buy) and purple (sell) on the sub-picture, corresponding to the main picture, you can subjectively judge that the quality of the trading point of the strategy is good Bad.
The second layer: "{Sextan} PINEv4 Sextans Backtest Framework". This script is the standardized trading system strategy execution and alarm, used to generate the final report of the strategy backtest and some key indicators that I have customized that I find useful, such as: winning rate , Odds, Winning Surface, Kelly Ratio, Take Profit and Stop Loss Thresholds, Trading Frequency, etc. are evaluated according to the Kelly formula. To use the second layer, first load it into the TrainingView chart, no markers will appear on the chart, since you have not specified any strategy source signals, click on the gear-shaped setting next to the "{Sextan} PINEv4 Sextans BTFW" header button, you can open the backtest settings, the first item is to select your custom strategy source. Because we have added the strategy source to the chart in the previous step, you can easily find an option "{Sextan} Your Indicator Source: Signal" at the bottom of the list, this is the strategy source input we need, select and confirm , you can see various markers on the main graph, and quickly generate a backtesting profit graph and a list of backtesting reports. You can generate files and download the backtesting reports locally. You can also click the gear on the backtest chart interface to customize some conditions of the backtest, including: initial capital amount, currency type, percentage of each order placed, amount of pyramid additions, commission fees, slippage, etc. configuration. Note: The configuration in the interface dialog overrides the same configuration implemented by the code in the backtest script.
How to output charts:
The first layer: "{Sextan} Your Indicator Source", the output of this script is the pulse value of yellow and purple, yellow +1 means buy, purple -1 means sell.
The second layer: PINEv4 Sextans Backtest Framework". The output of this script is a bit complicated. After all, it is the entire trading system with a lot of information:
1. Blue and red arrows. The blue upward arrow indicates long position, the red downward arrow indicates short position, and the horizontal bar at the end of the purple arrow indicates take profit or stop loss exit.
2. Red and green lines. This is the holding cost line of the strategy, green represents the cost of holding a long position, and red represents the cost of holding a short position. The cost line is a continuous solid line and the price action is relatively close.
3. Green and yellow long take profit and stop loss area and green and yellow long take profit and stop loss fork. Once a long position is held, there is a conditional order for take profit and stop loss. The green horizontal line is the long take profit ratio line, and the yellow is the long stop loss ratio line; the green cross indicates the long take profit price, and the yellow cross indicates the long position. Stop loss price. It's worth noting that the prongs and wires don't necessarily go together. Because of the optimization of the algorithm, for a strong market, the take profit will occur after breaking the take profit line, and the profit will not be taken until the price falls.
4. The purple and red short take profit and stop loss area and the purple red short stop loss fork. Once a short position is held, there will be a take profit and stop loss conditional order, the red is the short take profit ratio line, and the purple is the short stop loss ratio line; the red cross indicates the short take profit price, and the purple cross indicates the short stop loss price.
5. In addition to the above signs, there are also text and numbers indicating the profit and loss values of long and short positions. "L" means long; "S" means short; "XL" means close long; "XS" means close short.
TradingView Strategy Tester Panel:
The overview graph is an intuitive graph that plots the blue (gain) and red (loss) curves of all backtest periods together, and notes: the absolute value and percentage of net profit, the number of all closed positions, the winning percentage, the profit factor, The maximum trading loss, the absolute value and ratio of the average trading profit and loss, and the average number of K-lines held in all trades.
Another is the performance summary. This is to display all long and short statistical indicators of backtesting in the form of a list, such as: net profit, gross profit, Sharpe ratio, maximum position, commission, times of profit and loss, etc.
Finally, the transaction list is a table indexed by the transaction serial number, showing the signal direction, date and time, price, profit and loss, accumulated profit and loss, maximum transaction profit, transaction loss and other values.
Remarks
Finally, I will explain that this is just the beginning of this model. I will continue to optimize the trading system of the second layer. Various optimization feedback and suggestions are welcome. For valuable feedback, I am willing to provide some L4/L5 technical indicators as rewards for free subscription rights.

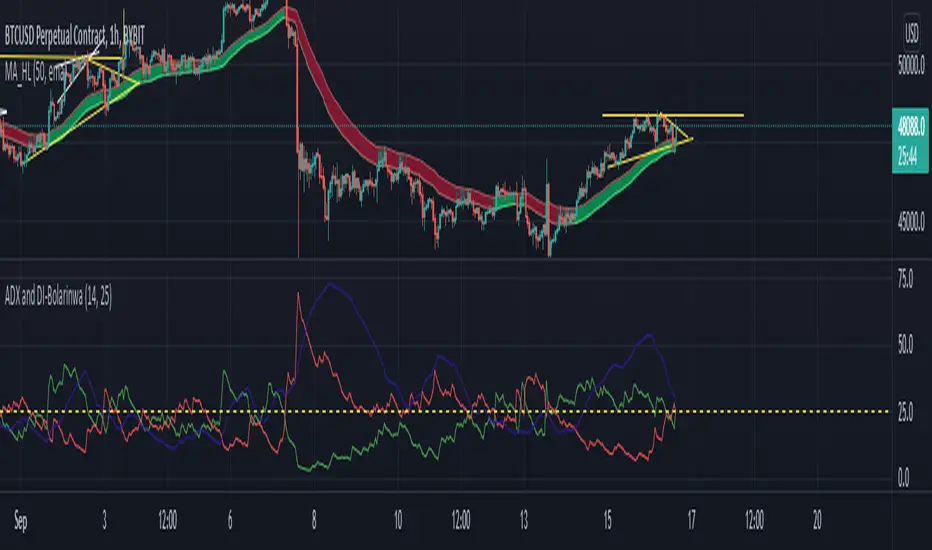
ADX and DI-BolarinwaThe Average Directional Movement Index (ADX) is a technical indicator that measures the strength of a trend. While the indicator itself doesn’t give an insight into the direction of the trend, the Directional Movement lines can be used to determine if the market moves up or down.
The ADX can return a value between 0 and 100. The usual threshold for a market to be considered as trending by the ADX is a value of 25 or above. Values between 25 and 50 signal a trending market, between 50 and 75 very strong trends and between 75 and 100 extremely strong trends.
The ADX Crossover Trading Strategy
A popular trading strategy to trade on the ADX is based on a crossover of the directional movement lines (+DI and -DI) which was developed directly by the indicator’s creator Mr. Wilder.
The trading strategy states that the first condition for a trade setup is that the ADX has a value of 25 or above, which indicates a trending market.
A buy order is triggered when +DI crosses above -DI, i.e. the underlying trend is an uptrend, while a sell signal is triggered when -DI crosses above +DI, i.e. the underlying trend is a downtrend.
Stop-losses are placed at the low of the current trading day, and the trade setup remains valid even if the directional movement lines cross again after the trade signal. Only a break of the current trading day’s low would lead to the trade setup becoming invalid.
If the ADX remains above 25 or rises even higher, indicating that the strength of the underlying trend increases, then traders can put a trailing stop on the trade.
The following chart shows an example of the ADX crossover strategy on the daily EUR/USD pair.
ADX Crossover Strategy
The first cross of -DI above +DI didn’t send a sell signal because the ADX was below 25. The sell signal came with ADX crossing above 25, while the -DI was still above +DI. On the chart, the SL was put just above the day’s high.
The second signal was a buy signal, with the cross of +DI above -DI and the ADX above 25, signaling a strong trend. The stop-loss is placed just below the day’s low, indicated by the dotted line on the chart.
Finally, the third sell signal came with the cross of -DI above -DI and the ADX above 25. Again, the stop-loss is placed just above the day’s high.
While the ADX crossover strategy can also be applied to lower timeframes, you need to be aware that the increased market noise may create more false signals than on the higher timeframes. The following chart is a 5-minute chart with buy and sell signals based on the crossover strategy. Notice that we placed the stop-losses slightly different than in the previous example. In this case, stop-losses have been placed at the recent highs and lows of the price.
ADX Trading Graph
The first buy signal came with +DI crossing above -DI and ADX above 25. In the middle of the chart, you can notice the crosses of the directional movement lines (+DI and -DI) while the ADX was below 25. As ADX needs to be above 25, those crosses are not used as entry triggers based on the ADX crossover strategy.
After that we received a sell signal with -DI crossing above +DI and ADX above 25, which is followed by a buy signal when +DI crossed above -DI.
Using ADX for Trade Confirmations
Beside the ADX crossover strategy which is based on the crosses of +DI and -DI, traders can also use the ADX indicator to supplement other trading strategies. For example, you might want to use a trend-following strategy when ADX shows a strong trend (value above 25), or a trading strategy that is more suited for ranging markets in times when the ADX shows an absence of trends (value below 25).
Before You Trade
The Average Directional Movement Index is a versatile technical indicator that can be used as a stand-alone trading strategy, or in combination with other trading strategies. The ADX crossover strategy is based on the crossover of the directional movement lines (+DI and -DI) and an ADX reading of above 25. While it can be used across all timeframes, it usually returns the best results on higher ones.
As the ADX measures the strength of the underlying trend, trend-following traders can use it to filter flat and ranging markets and avoid trading during those times.
888 BOT #backtest█ 888 BOT #backtest (open source)
This is an Expert Advisor 'EA' or Automated trading script for ‘longs’ and ‘shorts’, which uses only a Take Profit or, in the worst case, a Stop Loss to close the trade.
It's a much improved version of the previous ‘Repanocha’. It doesn`t use 'Trailing Stop' or 'security()' functions (although using a security function doesn`t mean that the script repaints) and all signals are confirmed, therefore the script doesn`t repaint in alert mode and is accurate in backtest mode.
Apart from the previous indicators, some more and other functions have been added for Stop-Loss, re-entry and leverage.
It uses 8 indicators, (many of you already know what they are, but in case there is someone new), these are the following:
1. Jurik Moving Average
It's a moving average created by Mark Jurik for professionals which eliminates the 'lag' or delay of the signal. It's better than other moving averages like EMA , DEMA , AMA or T3.
There are two ways to decrease noise using JMA . Increasing the 'LENGTH' parameter will cause JMA to move more slowly and therefore reduce noise at the expense of adding 'lag'
The 'JMA LENGTH', 'PHASE' and 'POWER' parameters offer a way to select the optimal balance between 'lag' and over boost.
Green: Bullish , Red: Bearish .
2. Range filter
Created by Donovan Wall, its function is to filter or eliminate noise and to better determine the price trend in the short term.
First, a uniform average price range 'SAMPLING PERIOD' is calculated for the filter base and multiplied by a specific quantity 'RANGE MULTIPLIER'.
The filter is then calculated by adjusting price movements that do not exceed the specified range.
Finally, the target ranges are plotted to show the prices that will trigger the filter movement.
Green: Bullish , Red: Bearish .
3. Average Directional Index ( ADX Classic) and ( ADX Masanakamura)
It's an indicator designed by Welles Wilder to measure the strength and direction of the market trend. The price movement is strong when the ADX has a positive slope and is above a certain minimum level 'ADX THRESHOLD' and for a given period 'ADX LENGTH'.
The green color of the bars indicates that the trend is bullish and that the ADX is above the level established by the threshold.
The red color of the bars indicates that the trend is down and that the ADX is above the threshold level.
The orange color of the bars indicates that the price is not strong and will surely lateralize.
You can choose between the classic option and the one created by a certain 'Masanakamura'. The main difference between the two is that in the first it uses RMA () and in the second SMA () in its calculation.
4. Parabolic SAR
This indicator, also created by Welles Wilder, places points that help define a trend. The Parabolic SAR can follow the price above or below, the peculiarity that it offers is that when the price touches the indicator, it jumps to the other side of the price (if the Parabolic SAR was below the price it jumps up and vice versa) to a distance predetermined by the indicator. At this time the indicator continues to follow the price, reducing the distance with each candle until it is finally touched again by the price and the process starts again. This procedure explains the name of the indicator: the Parabolic SAR follows the price generating a characteristic parabolic shape, when the price touches it, stops and turns ( SAR is the acronym for 'stop and reverse'), giving rise to a new cycle. When the points are below the price, the trend is up, while the points above the price indicate a downward trend.
5. RSI with Volume
This indicator was created by LazyBear from the popular RSI .
The RSI is an oscillator-type indicator used in technical analysis and also created by Welles Wilder that shows the strength of the price by comparing individual movements up or down in successive closing prices.
LazyBear added a volume parameter that makes it more accurate to the market movement.
A good way to use RSI is by considering the 50 'RSI CENTER LINE' centerline. When the oscillator is above, the trend is bullish and when it is below, the trend is bearish .
6. Moving Average Convergence Divergence ( MACD ) and ( MAC-Z )
It was created by Gerald Appel. Subsequently, the histogram was added to anticipate the crossing of MA. Broadly speaking, we can say that the MACD is an oscillator consisting of two moving averages that rotate around the zero line. The MACD line is the difference between a short moving average 'MACD FAST MA LENGTH' and a long moving average 'MACD SLOW MA LENGTH'. It's an indicator that allows us to have a reference on the trend of the asset on which it is operating, thus generating market entry and exit signals.
We can talk about a bull market when the MACD histogram is above the zero line, along with the signal line, while we are talking about a bear market when the MACD histogram is below the zero line.
There is the option of using the MAC-Z indicator created by LazyBear, which according to its author is more effective, by using the parameter VWAP ( volume weighted average price ) 'Z-VWAP LENGTH' together with a standard deviation 'STDEV LENGTH' in its calculation.
7. Volume Condition
Volume indicates the number of participants in this war between bulls and bears, the more volume the more likely the price will move in favor of the trend. A low trading volume indicates a lower number of participants and interest in the instrument in question. Low volumes may reveal weakness behind a price movement.
With this condition, those signals whose volume is less than the volume SMA for a period 'SMA VOLUME LENGTH' multiplied by a factor 'VOLUME FACTOR' are filtered. In addition, it determines the leverage used, the more volume , the more participants, the more probability that the price will move in our favor, that is, we can use more leverage. The leverage in this script is determined by how many times the volume is above the SMA line.
The maximum leverage is 8.
8. Bollinger Bands
This indicator was created by John Bollinger and consists of three bands that are drawn superimposed on the price evolution graph.
The central band is a moving average, normally a simple moving average calculated with 20 periods is used. ('BB LENGTH' Number of periods of the moving average)
The upper band is calculated by adding the value of the simple moving average X times the standard deviation of the moving average. ('BB MULTIPLIER' Number of times the standard deviation of the moving average)
The lower band is calculated by subtracting the simple moving average X times the standard deviation of the moving average.
the band between the upper and lower bands contains, statistically, almost 90% of the possible price variations, which means that any movement of the price outside the bands has special relevance.
In practical terms, Bollinger bands behave as if they were an elastic band so that, if the price touches them, it has a high probability of bouncing.
Sometimes, after the entry order is filled, the price is returned to the opposite side. If price touch the Bollinger band in the same previous conditions, another order is filled in the same direction of the position to improve the average entry price, (% MINIMUM BETTER PRICE ': Minimum price for the re-entry to be executed and that is better than the price of the previous position in a given %) in this way we give the trade a chance that the Take Profit is executed before. The downside is that the position is doubled in size. 'ACTIVATE DIVIDE TP': Divide the size of the TP in half. More probability of the trade closing but less profit.
█ STOP LOSS and RISK MANAGEMENT.
A good risk management is what can make your equity go up or be liquidated.
The % risk is the percentage of our capital that we are willing to lose by operation. This is recommended to be between 1-5%.
% Risk: (% Stop Loss x % Equity per trade x Leverage) / 100
First the strategy is calculated with Stop Loss, then the risk per operation is determined and from there, the amount per operation is calculated and not vice versa.
In this script you can use a normal Stop Loss or one according to the ATR. Also activate the option to trigger it earlier if the risk percentage is reached. '% RISK ALLOWED'
'STOP LOSS CONFIRMED': The Stop Loss is only activated if the closing of the previous bar is in the loss limit condition. It's useful to prevent the SL from triggering when they do a ‘pump’ to sweep Stops and then return the price to the previous state.
█ BACKTEST
The objective of the Backtest is to evaluate the effectiveness of our strategy. A good Backtest is determined by some parameters such as:
- RECOVERY FACTOR: It consists of dividing the 'net profit' by the 'drawdown’. An excellent trading system has a recovery factor of 10 or more; that is, it generates 10 times more net profit than drawdown.
- PROFIT FACTOR: The ‘Profit Factor’ is another popular measure of system performance. It's as simple as dividing what win trades earn by what loser trades lose. If the strategy is profitable then by definition the 'Profit Factor' is going to be greater than 1. Strategies that are not profitable produce profit factors less than one. A good system has a profit factor of 2 or more. The good thing about the ‘Profit Factor’ is that it tells us what we are going to earn for each dollar we lose. A profit factor of 2.5 tells us that for every dollar we lose operating we will earn 2.5.
- SHARPE: (Return system - Return without risk) / Deviation of returns.
When the variations of gains and losses are very high, the deviation is very high and that leads to a very poor ‘Sharpe’ ratio. If the operations are very close to the average (little deviation) the result is a fairly high 'Sharpe' ratio. If a strategy has a 'Sharpe' ratio greater than 1 it is a good strategy. If it has a 'Sharpe' ratio greater than 2, it is excellent. If it has a ‘Sharpe’ ratio less than 1 then we don't know if it is good or bad, we have to look at other parameters.
- MATHEMATICAL EXPECTATION: (% winning trades X average profit) + (% losing trades X average loss).
To earn money with a Trading system, it is not necessary to win all the operations, what is really important is the final result of the operation. A Trading system has to have positive mathematical expectation as is the case with this script: ME = (0.87 x 30.74$) - (0.13 x 56.16$) = (26.74 - 7.30) = 19.44$ > 0
The game of roulette, for example, has negative mathematical expectation for the player, it can have positive winning streaks, but in the long term, if you continue playing you will end up losing, and casinos know this very well.
PARAMETERS
'BACKTEST DAYS': Number of days back of historical data for the calculation of the Backtest.
'ENTRY TYPE': For '% EQUITY' if you have $ 10,000 of capital and select 7.5%, for example, your entry would be $ 750 without leverage. If you select CONTRACTS for the 'BTCUSDT' pair, for example, it would be the amount in 'Bitcoins' and if you select 'CASH' it would be the amount in $ dollars.
'QUANTITY (LEVERAGE 1X)': The amount for an entry with X1 leverage according to the previous section.
'MAXIMUM LEVERAGE': It's the maximum allowed multiplier of the quantity entered in the previous section according to the volume condition.
The settings are for Bitcoin at Binance Futures (BTC: USDTPERP) in 15 minutes.
For other pairs and other timeframes, the settings have to be adjusted again. And within a month, the settings will be different because we all know the market and the trend are changing.

Martingale Grid BotMartingale Grid Bot (MGB)
The strategy is designed to test grid trading with a possible increase in the size of each subsequent order based on the martingale principle. The strategy itself does not contain any trade decision logic and is fully driven by external signals coming from indicators used on the chart. A new grid of orders is created when an entry signal is received, provided that there is no active grid.
❗ Warning
Trading with leverage and martingale involves increased risk. This strategy is a rather rough tool and is intended for testing purposes only. The author is not responsible for any possible discrepancies between the strategy results and real trading.
Settings
Direction - Trading direction. Possible values: Long and Short.
Entry Signal Source - Source of the entry signal that initiates the creation of a new order grid. If one of the price sources (open, high, low, close, etc.) is selected, a new grid will be created automatically after the previous grid is fully closed.
Start Time - Date and time when the strategy starts operating. Marked on the chart with a vertical dashed line.
No Repainting Mode - A mode intended to reduce discrepancies between historical and real-time strategy behavior (repainting).
Enabled — a new grid is created only after the bar is closed. The first order can be filled no earlier than on the next bar.
Disabled — in real-time, a new grid can be created immediately upon receiving a signal or after the previous grid is closed by take profit or stop loss.
❗ Attention
For correct real-time operation, recalculation on every tick must be enabled in the strategy settings.
GRID
Grid Depth % - The depth of the order grid, specified as a percentage of the closing price at the moment the grid is created.
Orders Count - The number of orders in the grid. The first order is placed at the current closing price at the time of grid creation.
Martingale Multiplier - Position size multiplier. Each subsequent order in the grid will be increased by this factor. The size of the first order is defined in the strategy settings.
Leverage - Leverage multiplier for margin trading. Used to check available funds when creating grid orders. It is recommended to use it together with the margin parameters in the strategy settings.
Take Profit % - Calculated on each strategy update based on the average entry price. If none of the grid orders have been filled yet, the take-profit level for the first order is displayed on the chart.
Stop Loss % - Calculated from the price of the first grid order and does not change during the strategy operation. Orders whose price exceeds the stop-loss level will be automatically canceled.
TABLE
Show Table - Controls the display of the table with all orders of the current grid. If there is no active grid, no order data is displayed. Text and background colors are determined automatically based on the chart background color.
Order Size - Determines how the grid order size is displayed: in contracts or in currency.
Table Size - Font size in the table.
Timezone - Used to correctly display the order fill time relative to the chart time. The order fill time (status: filled) can be seen by hovering over the corresponding status cell in the table.
VISUAL
Long Entry - Color of the dotted lines representing grid orders when trading long. Also defines the color of the vertical line indicating the strategy start time.
Short Entry - Color of the dotted lines representing grid orders when trading short. Also defines the color of the vertical line indicating the strategy start time.
Take Profit - Color of the solid line representing the take-profit level.
Stop Loss - Color of the solid line representing the stop-loss level.

ICT Pro [KTY]Hi, I'm Kim Thank You 👋
KTY = Kim Thank You (김땡큐)
【ICT Pro】📊
Essential ICT tools for Smart Money trading.
5 core features to identify institutional order flow and high-probability trade setups.
━━━━━━━━━━━━━━━━━━━━━━━━━━━━━━━
💡 NEW TO THIS INDICATOR?
Open Settings and hover over the (i) icon on each feature for detailed tooltips.
Check the 📚 User Guide section at the bottom of Settings for quick reference.
━━━━━━━━━━━━━━━━━━━━━━━━━━━━━━━
📊 FEATURES
━━━━━━━━━━━━━━━━━━━━━━━━━━━━━━━
✅ Order Block (OB)
Price zones where Smart Money executed large buy/sell orders, acting as strong support/resistance levels.
- Bullish OB: Last bearish candle before an up move → Support
- Bearish OB: Last bullish candle before a down move → Resistance
📈 Box Display Info
- Vol: Volume at OB formation
- (%): Upper/Lower volume balance ratio
- Closer to 100% = Balanced buy/sell
- Lower = Strong one-sided order flow → Stronger S/R zone
📍 OB Body Lines
- Dotted lines showing candle body position within OB
- Use for precise entry points
━━━━━━━━━━━━━━━━━━━━━━━━━━━━━━━
✅ Liquidity Zone
Areas where stop-loss orders are clustered around swing highs/lows, becoming targets for Smart Money.
- Buyside Liquidity: Stop-losses above highs where shorts get liquidated
- Sellside Liquidity: Stop-losses below lows where longs get liquidated
- Liquidity Sweep: Price hunts stops then reverses sharply
📈 Box Display Info
- (%): Relative size compared to recent volume
- Higher = More stop orders clustered
- More likely to be a major target for Smart Money
💡 Quick reversal after liquidity break = Reversal signal
━━━━━━━━━━━━━━━━━━━━━━━━━━━━━━━
✅ Fair Value Gap (FVG)
A gap created when price moves rapidly between 3 candles, where price tends to return to fill this zone.
- Bullish FVG: Forms during sharp rallies → Acts as support on pullbacks
- Bearish FVG: Forms during sharp drops → Acts as resistance on bounces
- CE (Consequent Encroachment): 50% level of FVG, key reaction level
📈 Box Display Info
- (%): Relative size compared to recent volume
- Higher = FVG formed by stronger move
- Acts as stronger S/R zone
💡 FVG overlapping with OB = Higher reliability
━━━━━━━━━━━━━━━━━━━━━━━━━━━━━━━
✅ Market Structure
Analyzes price swing highs/lows to identify current trend and reversal points.
- CHoCH (Change of Character): Trend reversal signal - first sign of direction change
- BOS (Break of Structure): Trend continuation signal - structure break in existing direction
⚙️ Structure Options
- INTERNAL: Short-term structure (fast reaction, more signals)
- EXTERNAL: Long-term structure (slower reaction, higher reliability)
- ALL: Display both internal + external structure
💡 CHoCH = Look for reversal | BOS = Trend continues
━━━━━━━━━━━━━━━━━━━━━━━━━━━━━━━
✅ Trend Candles
Candle colors change based on market structure (BOS/CHoCH) direction.
- Bullish Color: After bullish structure break
- Bearish Color: After bearish structure break
💡 Color change = Potential trend shift
💡 Quickly identify overall market direction at a glance
━━━━━━━━━━━━━━━━━━━━━━━━━━━━━━━
📈 HIGHER RELIABILITY SETUPS
━━━━━━━━━━━━━━━━━━━━━━━━━━━━━━━
- Higher timeframe = More reliable signals
- Multiple features pointing to same price zone
(e.g. OB + FVG overlap = Strong confluence)
- Trend Candles + Market Structure direction aligned
- Quick reversal after Liquidity sweep
━━━━━━━━━━━━━━━━━━━━━━━━━━━━━━━
💡 TRADING TIPS
━━━━━━━━━━━━━━━━━━━━━━━━━━━━━━━
1. Identify Liquidity targets first
2. Wait for price to reach OB or FVG zone
3. Confirm with Market Structure (CHoCH/BOS)
4. Enter at OB body lines or FVG CE level
5. Stop loss below/above the zone
━━━━━━━━━━━━━━━━━━━━━━━━━━━━━━━
⚠️ DISCLAIMER
This indicator is for educational purposes only.
Not financial advice. Always do your own research.
Past performance does not guarantee future results.

Risk & Lot Calculator PanelFXMANS Risk & Lot Panel
Smart Risk Management Tool for TradingView
- Overview
FXMANS Risk & Lot Panel is a lightweight and professional risk management tool designed to help traders calculate position size (lot) and take-profit levels directly on the chart, without cluttering the screen.
The panel is displayed as a minimal table in the top-right corner of the chart and automatically adapts to the currently opened symbol.
This tool focuses on clarity, precision, and usability, making it suitable for scalpers, day traders, and swing traders.
- Key Features
Automatic Direction Detection
The script can automatically determine BUY or SELL direction based on:
Entry Price
Stop Loss Price
Logic:
Stop Loss below Entry → BUY
Stop Loss above Entry → SELL
Manual override is available if auto direction is disabled.
Risk-Based Lot Size Calculation
Calculates position size based on:
User-defined risk amount in USD
Distance between Entry and Stop Loss
Symbol-specific tick size and point value
Ensures consistent risk management across all markets.
Automatic Take Profit (RR Based)
Take Profit is calculated automatically using a predefined Risk / Reward (RR) ratio.
Supports both BUY and SELL scenarios.
- Symbol-Aware Calculation
Uses TradingView’s built-in symbol properties:
syminfo.mintick
syminfo.pointvalue
Works correctly on:
Forex
Indices
Metals
Crypto
- Minimal & Non-Intrusive UI
Small, fixed panel located at the top-right corner
Designed to avoid covering price action
Clean FXMANS-style color palette
- Safe Panel Size Control
Panel size can be adjusted from settings:
Small
Medium
Large
Size changes are handled without modifying layout geometry, preventing UI bugs.
- How It Works
Enter your Entry Price and Stop Loss Price
Define your Risk Amount ($)
Set your desired Risk / Reward ratio
The script automatically calculates:
Trade Direction (BUY / SELL)
Lot Size
Take Profit Level
All results are displayed instantly in the panel
- Example Use Case
Risk: $100
Entry: 1.0850
Stop Loss: 1.0800
RR: 2.0
- The panel will automatically display:
Direction: BUY
Lot Size adjusted to risk exactly $100
Take Profit at 2R
- Important Notes
Entry and Stop Loss prices must be valid (greater than zero).
The tool does not place trades automatically.
Calculations are for position sizing only and may vary slightly depending on broker specifications.
- Disclaimer
This script is intended for educational and analytical purposes only.
Trading involves risk, and users are responsible for their own trading decisions.
- Ideal For
Traders who follow strict risk management rules
Forex, crypto, and index traders
Scalpers and intraday traders
Anyone who wants clean and fast position sizing on TradingView

London Breakout Optimized PFBest Practices:
Only take trades in trend and above/below VWAP
Avoid trading in low-volume or sideways markets
Use it for intraday 5-min charts (15-min for trend confirmation)
Track trades in a Trading Journal → improves discipline
Entry Rules:
Long (Buy):
Price above EMA21 & VWAP → bullish trend
EMA slope positive → strong trend confirmation
Pullback to entry zone OR breakout above resistance
Volume above 1.3× average → avoids weak moves
Short (Sell):
Price below EMA21 & VWAP → bearish trend
EMA slope negative → strong downtrend
Pullback to entry zone OR breakout below support
Volume above 1.3× average
Exit Rules:
Stop-Loss: ATR-based, dynamic (tight for fewer losses)
Take Profit: Risk × 3 (3:1 R:R)
Automatically handled by the strategy (strategy.exit)

Gapper SHORT Signal# TradingView Publication Description
## Title
**Gapper Short Signal - Genetic Optimized (81.8% Win Rate)**
---
## Short Description
Data-driven short signal for fading overextended gap-up stocks. Optimized using genetic algorithms on 166 historical gappers.
---
## Full Description
### 📊 What Is This?
A **precision short signal** designed specifically for fading gap-up stocks that have become overextended. Unlike indicators built on gut feeling or traditional rules, this signal was **discovered by a genetic algorithm** that analyzed 166 real gapper stocks over 70 trading days.
The algorithm tested thousands of signal combinations and evolved over 50 generations to find the exact conditions that preceded profitable short entries.
---
### 🎯 Performance (Backtest)
| Metric | Value |
|--------|-------|
| **Win Rate** | 81.8% |
| **Profit Factor** | 20.34 |
| **Stop Loss** | 3.4% |
| **Take Profit** | 8.6% |
*Based on 166 gapper stocks, $1-20 price range, >3% gap, >100k volume*
---
### 🔍 How It Works
The indicator fires a SHORT signal when **ALL 5 conditions** are met:
**1. Overextended Above VWAP**
Price must be trading more than 1.5 ATR above VWAP. This means the stock has run too far, too fast and is stretched like a rubber band.
**2. Volume Dying Down**
NOT a volume climax (RVOL < 3x). We want to see buying pressure fading, not a blowoff top with massive volume.
**3. Rejection Candle (Key Signal!)**
Upper wick must be >51% of the candle range. This is the smoking gun - price tried to push higher but got slammed back down. Sellers are stepping in.
**4. Still Elevated**
Price must be at least 6.66% above the low of day. We want to short stocks that are still high, not ones that have already crashed.
**5. Time Window**
Within the first 5.5 hours of trading. Gapper fades work best when there's still time in the day for the move to play out.
---
### 📈 Best Used On
- **Timeframe:** 1-minute charts
- **Stocks:** Gap-up stocks (>3% gap from previous close)
- **Price Range:** $1-20 (small caps / penny stocks)
- **Volume:** High relative volume days
- **Session:** Regular trading hours
---
### 🖥️ Features
✅ Clean visual signals (red triangles)
✅ Auto-drawn stop loss and take profit levels
✅ Real-time info table showing all conditions
✅ Condition status indicators (✓/✗)
✅ Entry label with exact stop/target prices
✅ Built-in alerts
---
### ⚙️ Settings
| Input | Default | Description |
|-------|---------|-------------|
| Stop Loss % | 3.4% | Distance to stop loss |
| Take Profit % | 8.6% | Distance to profit target |
| Show Info Table | On | Display condition status |
| Show All Conditions | Off | Expanded table view |
---
### 🧬 The Science Behind It
This indicator wasn't designed by a human - it was **evolved**.
A genetic algorithm started with 100 random indicator configurations, each with different entry conditions and thresholds. These "individuals" were backtested against historical gapper data, and the top performers were bred together to create the next generation.
After 50 generations of evolution, only the fittest signals survived. The result is the 5-condition setup you see here.
**Why genetic optimization?**
- Removes human bias from signal design
- Tests combinations humans would never think of
- Finds exact threshold values (not round numbers)
- Adapts to real market data, not theory
---
### ⚠️ Important Notes
**This is a tool, not a guarantee.**
- Backtest performance ≠ future results
- 11 trades in backtest = small sample size
- Always use proper position sizing
- Paper trade before going live
- Works best on liquid stocks with tight spreads
**Risk Management is Everything**
The 81.8% win rate means nothing if you size incorrectly or move your stops. Stick to the 3.4% stop / 8.6% target that the algorithm optimized for.
---
### 💡 Trading Tips
1. **Wait for the signal** - Don't anticipate. Let all 5 conditions align.
2. **Check the table** - Use the info panel to see which conditions are met.
3. **Respect the stop** - The 3.4% stop is part of the edge. Don't widen it.
4. **Let winners run** - 8.6% target gives you 2.5:1 reward-to-risk.
5. **One trade per setup** - Don't re-enter if stopped out.
---
### 🔔 Alerts
Set up alerts for "SHORT Signal" to get notified when all conditions align. Works with TradingView mobile notifications.
---
### 📝 Changelog
**v1.0** (January 2026)
- Initial release
- Genetic optimization on 166 gappers / 70 trading days
- 5-condition SHORT signal
---
### 🙏 Credits
Built using genetic algorithm optimization techniques applied to Polygon.io historical data. Special thanks to the algo trading community for inspiration.
---
### ⚖️ Disclaimer
This indicator is for educational and informational purposes only. It is not financial advice. Trading involves substantial risk of loss. Past performance does not guarantee future results. Always do your own research and consult with a qualified financial advisor before making trading decisions.
---
## Tags
`short` `gapper` `gap-up` `fade` `mean-reversion` `genetic-algorithm` `machine-learning` `day-trading` `momentum` `vwap` `rejection` `small-cap` `penny-stocks`
---
## Category
Trend Analysis / Momentum / Volatility

Pro Cumulative Volume RSI# Pro Cumulative Volume RSI - Professional Trading Indicator
## 📊 What is it?
The **Pro Cumulative Volume RSI** is an advanced momentum oscillator that analyzes buying and selling pressure through volume distribution. Unlike traditional RSI that only tracks price movements, this indicator separates volume into buying and selling components, providing two distinct RSI calculations that reveal market dynamics from both perspectives.
## 🔍 How Does It Work?
### Volume Distribution Algorithm
The indicator uses a sophisticated volume distribution method:
**Buying Volume (BV)** = Volume × (Close - Low) / (High - Low)
**Selling Volume (SV)** = Volume × (High - Close) / (High - Low)
This formula proportionally allocates volume based on where the candle closes within its range:
- If close is near the high → More buying volume
- If close is near the low → More selling volume
### Dual RSI Calculation
The indicator then calculates **two separate RSI values**:
1. **Green Line (Buying Volume RSI)**: Measures the dominance of buying pressure
2. **Red Line (Selling Volume RSI)**: Measures the dominance of selling pressure
Each RSI follows the traditional 14-period calculation but applies it to the volume pressure differences rather than price changes.
## 🎯 How to Use It
### Signal Interpretation
| Scenario | Meaning | Action |
|----------|---------|--------|
| Green > 70, Red < 30 | Strong buying dominance | Consider buying / Hold long |
| Red > 70, Green < 30 | Strong selling dominance | Consider selling / Avoid longs |
| Green crosses above Red | Momentum shift to buyers | Potential buy signal |
| Red crosses above Green | Momentum shift to sellers | Potential sell signal |
| Both near 50 | Balanced market | Wait for confirmation |
### Key Features
**1. Crossover Signals**
- **BUY signal**: When green line crosses above red line with sufficient momentum
- **SELL signal**: When red line crosses above green line with sufficient momentum
- Triangle markers appear automatically on the chart
**2. Divergence Detection**
- **Bullish Divergence (DIV+)**: Price makes lower lows but indicator makes higher lows → Potential reversal up
- **Bearish Divergence (DIV-)**: Price makes higher highs but indicator makes lower highs → Potential reversal down
- Yellow/orange circles mark divergences automatically
**3. Background Coloring**
- **Green background**: Buying pressure dominates
- **Red background**: Selling pressure dominates
- Intensity shows strength of pressure
**4. Live Status Table**
- Real-time RSI values for both buying and selling
- Current momentum status
- Market pressure assessment
- Last detected signal
### Settings Customization
**Basic Settings:**
- **RSI Period**: Default 14, adjust based on your trading timeframe (shorter = more sensitive)
**Visual Settings:**
- **Histogram Mode**: Toggle between line and histogram display
- **Background Coloring**: Enable/disable pressure-based background
- **Transparency**: Adjust background opacity
**Signal Settings:**
- **Crossover Signals**: Show/hide BUY/SELL markers
- **Divergence Detection**: Enable automatic divergence spotting
- **Sensitivity**: Low/Medium/High - controls how strong momentum must be for signals
**Level Lines:**
- **Overbought/Oversold**: Adjust threshold levels (default 70/30)
## ⚠️ IMPORTANT DISCLAIMER
### This Indicator Should NOT Be Used Alone
**ALWAYS combine this indicator with other forms of analysis:**
✅ **Price Action Analysis**
- Support and resistance levels
- Trend lines and chart patterns
- Candlestick formations
✅ **Other Technical Indicators**
- Moving Averages (trend confirmation)
- MACD (momentum confirmation)
- Volume Profile (context)
- ATR (volatility assessment)
- Bollinger Bands (volatility and extremes)
✅ **Multiple Timeframe Analysis**
- Check higher timeframes for overall trend
- Use lower timeframes for precise entries
- Ensure signals align across timeframes
✅ **Fundamental Analysis**
- News and economic events
- Earnings reports (for stocks)
- Market sentiment
- Macro conditions
✅ **Risk Management**
- **NEVER** risk more than 1-2% per trade
- Always use stop losses
- Calculate position size before entering
- Have a clear exit strategy
### Common Pitfalls to Avoid
❌ **Don't** take every signal blindly
❌ **Don't** ignore the overall market trend
❌ **Don't** trade against strong momentum without confirmation
❌ **Don't** forget about major support/resistance levels
❌ **Don't** over-leverage based on indicator signals
❌ **Don't** ignore fundamental catalysts
### Best Practices
✅ **Wait for confluence**: Multiple indicators agreeing
✅ **Consider market context**: Bull/bear market conditions
✅ **Use appropriate timeframes**: Match your trading style
✅ **Backtest first**: Test on historical data before live trading
✅ **Keep a trading journal**: Track what works and what doesn't
✅ **Respect your risk management rules**: Always
## 📈 Example Trading Scenarios
### Scenario 1: Strong Trend Following
- **Setup**: Green RSI consistently above 50, price in uptrend
- **Confirmation**: Higher timeframe trend is up, price above major MA
- **Entry**: BUY signal on pullback when green crosses red
- **Stop Loss**: Below recent swing low
- **Exit**: When red RSI crosses above green or divergence appears
### Scenario 2: Reversal Trading
- **Setup**: Bullish divergence (DIV+) appears at support level
- **Confirmation**: Price shows bullish candlestick pattern, other oscillators oversold
- **Entry**: After confirmation candle closes
- **Stop Loss**: Below divergence low
- **Exit**: At resistance or when momentum weakens
### Scenario 3: Avoiding False Signals
- **Signal**: BUY signal appears
- **Check**: Price is at strong resistance, higher timeframe shows downtrend
- **Action**: **SKIP the trade** - context overrides signal
- **Result**: Protected capital by avoiding low-probability setup
## 🎓 Educational Use
This indicator is designed to help traders:
- Understand volume-based momentum
- Identify shifts in market pressure
- Learn about divergence patterns
- Practice multi-indicator analysis
**Remember**: No indicator is perfect. Markets are complex and influenced by countless factors. Use this tool as one piece of your trading puzzle, not as a standalone solution.
## 📞 Support & Updates
- Report bugs or suggest features via comments
- Check back for updates and improvements
- Share your successful setups to help the community learn
## ⚖️ Legal Disclaimer
**This indicator is for educational and informational purposes only.**
- Not financial advice
- Past performance does not guarantee future results
- Trading involves substantial risk of loss
- Only trade with money you can afford to lose
- Consult with a licensed financial advisor before making investment decisions
**The creator of this indicator assumes no responsibility for trading losses incurred through its use.**
---
## 🚀 Happy Trading!
Remember: **Patience, discipline, and proper risk management** are more important than any indicator. Trade smart, trade safe!
*If you find this indicator helpful, please leave a comment and share your experience!*

Anhnga4.0 - Filter ToggleINPUTS:
1.5 0.8 (OR 1.6 0.5/0.6)
BE=0.45
1
MAs: 35 135
7
This Pine Script code defines a trading strategy named **"Anhnga4.0 - Filter Toggle"**. It is a trend-following strategy that uses momentum oscillators and moving averages to identify entries, while featuring a specific "Overextension Filter" to avoid buying at the top or selling at the bottom.
Here is a breakdown of how the script works:
---
## 1. Core Trading Logic (The Entry)
The strategy looks for a "perfect storm" of three factors before entering a trade:
* **Momentum (WaveTrend):** It uses the WaveTrend oscillator (`wt1` and `wt2`).
* **Long:** A bullish crossover happens while the oscillator is below the zero line (oversold).
* **Short:** A bearish crossunder happens while the oscillator is above the zero line (overbought).
* **Trend Confirmation:** The price must be on the "correct" side of three different lines: the 20-period Moving Average (BB Basis), the 50-period SMA, and the 200-period SMA.
* **The Window:** You don't have to enter exactly on the cross. The `Signal Window` allows the trade to trigger up to 4 bars after the momentum cross, provided the trend filters align.
## 2. The "Overextension" Filter
This is a unique feature of this script. It calculates the distance between the current price and the **50-period Moving Average**.
* If the price is too far away from the MA (defined by the **ATR Limit**), the script assumes the move is "exhausted."
* If `Enable Overextension Filter?` is on, the strategy will skip these trades to avoid "chasing the pump."
* **Visual Cue:** The chart background turns **purple** when the price is considered overextended.
---
## 3. Risk Management & Exit Strategy
The script manages trades dynamically using Bollinger Bands and Risk:Reward ratios:
| Feature | Description |
| --- | --- |
| **Stop Loss (SL)** | Set at the **Lower Bollinger Band** for Longs and **Upper Band** for Shorts. |
| **Take Profit (TP)** | Calculated based on your **RR Ratio** (default is 2.0). If your risk is $10, it sets the target at $20 profit. |
| **Breakeven** | A "protection" feature. Once the price moves in your favor by a certain amount (the `Breakeven Trigger`), the script moves the Stop Loss to your entry price to ensure a "risk-free" trade. |
---
## 4. Visual Elements on the Chart
* **Green Lines:** Your target price (TP).
* **Red Lines:** Your initial Stop Loss.
* **Yellow Lines:** Indicates the Stop Loss has been moved to **Breakeven**.
* **Purple Background:** High alert—price is overextended; trades are likely being filtered out.
---
## Summary of Settings
* **BB Multiplier:** Controls how wide your initial stop loss is.
* **ATR Limit:** Controls how sensitive the "Overextension" filter is (higher = more trades allowed; lower = stricter filtering).
* **Breakeven Trigger:** Set to 1.0 by default, meaning once you are "1R" (profit equals initial risk) in profit, the stop moves to entry.

XAUUSD Lot Size Calculator1. What This Indicator Does
This tool is a Visual Risk Management System. Instead of using a calculator on your phone or switching tabs, it allows you to calculate the exact lot size for your trade directly on the TradingView chart by dragging lines.
It automates the math for:
Lot Size: How big your position should be to risk exactly X% of your account.
Take Profit: Where your target should be based on your Risk-to-Reward ratio.
Safety Checks: It warns you if your stop loss is too tight for the minimum lot size (0.01).
2. Visual Features
🔴 The Red Line (Stop Loss): This is your interactive line. You can grab it with your mouse and drag it to your desired invalidation point (e.g., below a support wick).
🟢 The Green Line (Take Profit): This line moves automatically. You cannot drag it. It calculates where your Take Profit must be to satisfy your Risk:Reward ratio (Default 1:1) based on where you placed the Red line.
⚫ The Info Table: A high-contrast black box in the corner that displays your calculated Lot Size, Risk amount, and Trade direction (Long/Short).
3. How to Use It (Step-by-Step)
Step 1: Initial Setup
When you first add the indicator to the chart, you need to tell it about your account:
Double-click the Black Table (or the Red Line) to open Settings.
Inputs Tab:
Account Balance: Enter your current trading balance (e.g., 10,000).
Risk %: Enter how much you want to lose per trade (e.g., 1.0%).
Contract Size: Keep this at 100 for Gold (XAUUSD) or standard Forex pairs.
Risk : Reward Ratio: Set your target (e.g., 1.0 for 1:1, or 2.0 for 1:2).
Step 2: Planning a Trade
Look at the chart and identify where you want to enter (current price) and where you want your Stop Loss.
Find the Red Line on your chart. (If you don't see it, go to Settings and change "Stop Loss Level" to a price near the current candle).
Click and Drag the Red Line to your specific Stop Loss price.
Step 3: Reading the Signals
Direction: If you drag the Red Line below the price, the table shows LONG. If you drag it above, it shows SHORT.
Lot Size: Read the big green number in the table (e.g., 0.55). This is the exact lot size you should enter in your broker.
TP Target: Look at the Green Line on the chart. That is your exit price.
Step 4: The "Orange Warning"
If you place your Stop Loss very close to the entry, or if your account is small, the math might suggest a lot size smaller than is possible (e.g., 0.004).
The table text will turn ORANGE.
The Lot Size will stick to 0.01 (the minimum).
The "Risk ($)" row will show you the actual risk. (Example: Instead of risking your desired $100, you might be forced to risk $105 because you can't trade smaller than 0.01 lots).

STAX# STAX - MapleStax Candle by Candle Automation
## Overview
STAX is a trend-following indicator that automates the "MapleStax Candle by Candle (CBC)" methodology for futures and equity trading. This system uses a higher timeframe anchor trend combined with lower timeframe execution filters to identify high-probability pullback entries in the direction of the prevailing trend.
## How It Works
### 1. Anchor Trend Detection (10-Minute CBC Flip)
The core of this system is the CBC (Candle by Candle) flip logic on the anchor timeframe (default: 10 minutes):
- **Bullish Flip**: Occurs when a 10m candle closes ABOVE the high of the previous 10m candle
- **Bearish Flip**: Occurs when a 10m candle closes BELOW the low of the previous 10m candle
- Once a flip occurs, the trend remains in that direction until an opposite flip happens
The anchor trend is calculated using `request.security()` with `lookahead=barmerge.lookahead_off` and indexed historical data ` ` to ensure non-repainting behavior. This means signals will not change or disappear after they appear.
### 2. Execution Filters (Current Timeframe)
On your current chart timeframe (recommended: 3 minutes), the indicator applies two key filters:
**EMA Confirmation**:
- For LONG signals: 9-period EMA must be greater than 20-period EMA
- For SHORT signals: 9-period EMA must be less than 20-period EMA
**VWAP Filter** (Strict or Target mode):
- **Strict Mode** (default): Only shows signals when price is on the correct side of VWAP
- LONG signals only above VWAP
- SHORT signals only below VWAP
- **Target Mode**: Shows all valid signals but uses VWAP as the take profit target when price is on the "wrong" side
### 3. Entry Signal Logic
The indicator looks for pullback entries:
- **BUY Signal**: 10m trend is Bullish + EMA 9 > 20 + Current 3m candle is RED (close < open)
- Logic: Wait for a red pullback candle in a bullish trend with bullish EMA alignment
- **SELL Signal**: 10m trend is Bearish + EMA 9 < 20 + Current 3m candle is GREEN (close > open)
- Logic: Wait for a green retracement candle in a bearish trend with bearish EMA alignment
This pullback logic helps you enter after a brief counter-trend move, improving risk/reward compared to chasing breakouts.
### 4. Risk Management
**Stop Loss**: Automatically set at the previous 10-minute candle's low (for longs) or high (for shorts). This represents the last swing point that would invalidate the trend structure.
**Take Profit**:
- When aligned with VWAP: Fixed tick-based target (default: 20 ticks, adjustable)
- When counter to VWAP: Target is VWAP itself, providing a logical profit target
The indicator displays TP and SL levels visually and alerts when they are hit.
### 5. Signal Management
To prevent over-trading, the indicator includes a **cooldown period** (default: 10 bars minimum between signals). This stops signal spam in choppy conditions and forces you to wait for the market to develop before taking another trade.
### 6. Time Session Filters
Two separate trading sessions can be configured with 12-hour clock inputs:
- **Session 1**: Default 9:30 AM - 4:00 PM (New York regular hours)
- **Session 2**: Optional second session for extended hours or different time zones
Signals only appear during enabled sessions, helping you trade during liquid market hours.
## What Makes This Original
This indicator automates a specific methodology (MapleStax CBC) that combines multiple proven concepts:
1. Higher timeframe trend structure (CBC flip logic)
2. Lower timeframe execution timing (EMA filters)
3. Pullback entry strategy (counter-colored candles)
4. Volume-based target selection (VWAP integration)
5. Swing-based stop placement (previous anchor swing points)
The combination of these elements into an automated system with visual feedback and alert functionality is what provides value beyond using these indicators separately.
## How to Use
1. **Choose Your Timeframes**:
- Anchor timeframe: 10 minutes (adjustable) for trend direction
- Execution timeframe: 3-5 minutes recommended for entries
2. **Select VWAP Mode**:
- **Strict Mode**: More conservative, only trades with VWAP bias
- **Target Mode**: More aggressive, uses VWAP as profit target
3. **Configure Sessions**: Enable Session 1 and optionally Session 2 to match your trading hours
4. **Set Risk Parameters**: Adjust take profit ticks based on your instrument and risk tolerance
5. **Watch for Signals**:
- Green "BUY" label below bars = Long entry
- Red "SELL" label above bars = Short entry
- Dashed red line = Stop loss level
- Green "TP ✓" or Red "SL ✗" labels show exit points
6. **Monitor the Status Table**: The table in the top-right shows:
- Current 10m trend direction
- EMA alignment status
- VWAP position
- Active session status
- Current signal state
- Active trade information
7. **Set Alerts**: Use TradingView's alert system with the built-in alert conditions:
- BUY Signal
- SELL Signal
- Take Profit Hit
- Stop Loss Hit
## Best Practices
- **Recommended Timeframes**: 3m execution chart with 10m anchor works well for active trading
- **Instrument Selection**: Works best on liquid futures contracts (ES, NQ, CL, etc.) and major forex pairs
- **Session Trading**: Enable Session 1 for New York hours; avoid low-volume periods
- **Backtest First**: Always backtest the settings on your specific instrument before live trading
- **Use Realistic Parameters**: Default 20-tick TP is conservative; adjust based on instrument volatility
## Limitations and Warnings
**This indicator does NOT**:
- Guarantee profitable trades (past performance does not indicate future results)
- Account for slippage, commissions, or real-world execution challenges
- Work equally well in all market conditions (performs poorly in low-volume, range-bound markets)
- Replace proper risk management and position sizing
- Provide financial advice
**Repainting**: This indicator is designed to be non-repainting. Signals use indexed historical data from the anchor timeframe, meaning they will not change or disappear after they appear. However, the current bar's status will update in real-time until it closes.
**Market Conditions**: This trend-following pullback system performs best in trending markets with clear directional bias. In choppy, range-bound conditions, expect more false signals despite the cooldown filter.
**Stop Loss Execution**: The stop loss levels shown are theoretical. In fast-moving markets, actual fills may occur at worse prices due to slippage.
## Input Parameters
**Anchor Settings**:
- Anchor Timeframe: Higher timeframe for trend detection (default: 10 minutes)
**EMA Settings**:
- Fast EMA: Short-period EMA for execution bias (default: 9)
- Slow EMA: Long-period EMA for execution bias (default: 20)
**VWAP Settings**:
- Strict VWAP Filter: Toggle between strict filtering and target mode
**Signal Management**:
- Min Bars Between Signals: Cooldown period to prevent spam (default: 10 bars)
**Time Filters**:
- Session 1 & 2: Configure up to two trading sessions with start/end times in 12-hour format
**Risk Management**:
- Take Profit (Ticks): Fixed tick target when aligned with VWAP (default: 20)
**Visual Settings**:
- Show Trend Background: Background color based on 10m trend
- Show Stop Loss Lines: Display SL levels on chart
- Show EMAs: Display 9/20 EMAs on chart
- Show VWAP: Display daily VWAP on chart
## Technical Notes
- Uses Pine Script v5
- Non-repainting implementation via `request.security()` with `lookahead_off` and indexed data
- Suitable for alerts and automated trading integration
- Maximum 50 labels and 50 lines to maintain performance
- Status table updates on each bar close
## Credits
This indicator automates the MapleStax Candle by Candle methodology. The CBC flip logic and pullback entry concept are part of the MapleStax trading education system.
---
**Disclaimer**: This indicator is for educational and informational purposes only. It is not financial advice. Trading futures, forex, and equities carries substantial risk of loss. Past performance is not indicative of future results. Always trade with risk capital you can afford to lose and use proper position sizing.

Smart Trader, Episode 02, by Ata Sabanci | Battle of Candles ⚠️ CRITICAL: READ BEFORE USING ⚠️
This indicator is 100% VOLUME-BASED and requires Lower Timeframe (LTF) intrabar data for accurate calculations. Please understand the following limitations before using:
📊 DATA ACCURACY LEVELS:
• 1T (Tick) — Most accurate, real volume distribution per tick
• 1S (1 Second) — Reasonably accurate approximation
• 15S (15 Seconds) — Good approximation, longer historical data available
• 1M (1 Minute) — Rough approximation, maximum historical data range
⚠️ BACKTEST & REPLAY LIMITATIONS:
• Replay mode results may differ from live trading due to data availability
• For longer back test periods, use higher LTF settings (15S or 1M)
• Not all symbols/exchanges support tick-level data
• Crypto and Forex typically have better LTF data availability than stocks
💡 A NOTE ON TOOLS:
Successful trading requires proper tools. Higher TradingView plans provide access to more historical intrabar data, which directly impacts the accuracy of volume-based calculations. More precise volume data leads to more reliable signals. Consider this when evaluating your trading infrastructure.
📌 OVERVIEW
Smart Trader Episode 02: Battle of Candles is an advanced educational indicator that combines multiple analysis engines to help traders identify market scenarios and understand market dynamics. This is NOT financial advice or a trading signal service — it's a learning tool designed to help you understand how institutional traders might interpret price action.
The indicator integrates 7 major analysis engines into a unified dashboard, providing real-time insights into volume flow, trend structure, market phases, and potential trade setups.
⚡ KEY FEATURES
🎯 16-Pattern Scenario Engine
Automatically detects and classifies market conditions into 16 distinct scenarios, from strong continuation moves to potential reversals and traps.
💰 Trade Advisor Panel
Aggregates all signals into actionable suggestions with confidence levels, suggested entry/SL/TP levels, and risk/reward calculations.
📊 Volume Engine
Splits volume into buy/sell components using either Geometry (candle shape) or Intrabar (LTF data) methods for precise delta analysis.
📈 CVD (Cumulative Volume Delta)
Tracks the running total of buying vs selling pressure to identify accumulation, distribution, and divergences.
🎯 Stop-Hunt Detection
Identifies potential stop-hunt patterns where price sweeps liquidity levels before reversing.
📐 Pure Structure Trend Engine
Zero-lag trend detection based on swing highs/lows (HH/HL/LH/LL) without any lagging indicators.
⚡ Effort vs Result Analysis
Measures energy spent (volume) versus ground taken (price movement) to detect stalls, breakthroughs, and exhaustion.
🎯 SCENARIO ENGINE — 16 Market Patterns
The Scenario Engine analyzes multiple factors (candle anatomy, volume, forces, CVD, wick analysis) to classify each candle into one of 16 scenarios:
Continuation Scenarios (1-3)
1. ⚔️ STRONG MOVE — Big body candle (>60%) with volume confirming direction. Indicates strong momentum continuation.
2. 🛡️ ABSORPTION — One side attacks but the other absorbs the pressure. Price holds despite volume. Continuation expected in the absorbing side's favor.
3. 📉 PULLBACK — Small move against the trend with low volume. Indicates a healthy retracement before trend continuation.
Reversal Scenarios (4-6, 13-16)
4. 💥 REJECTION — Big wick (>40%) with small body and high volume. Price was rejected
at a level, potential reversal.
5. 🪤 TRAP — Pin direction disagrees with delta. Extreme wick size. Looks bullish/bearish but the opposite may happen.
6. 😫 EXHAUSTION — High energy spent (volume) but low ground taken (price movement). Both sides active but momentum fading.
13. 🔄 CVD BULL DIV — Price falling but CVD rising. Hidden buying detected (accumulation). Potential bullish reversal.
14. 🔄 CVD BEAR DIV — Price rising but CVD falling. Hidden selling detected (distribution). Potential bearish reversal.
15. 🎯 STOP HUNT BULL — Shorts were liquidated below support. Price swept liquidity and reversed. Expect bullish move.
16. 🎯 STOP HUNT BEAR — Longs were liquidated above resistance. Price swept liquidity and reversed. Expect bearish move.
Range/Stalemate Scenarios (7-9)
7. ⚖️ DEADLOCK — Market in balance. Force ratio between 0.4-0.6. Low volume. No side winning.
8. 🔥 BATTLE — High volume fight in a range. Both sides attacking. Wicks on both ends of candle.
9. 🎯 WAITING — Building phase with quiet volume. Market is preparing but no trigger yet. Wait for breakout.
Pre-Breakout Scenarios (10-12)
10. 🚀 BULL SETUP — Buyers accumulating in a building phase. Positive delta building. Bullish pressure growing.
11. 💣 BEAR SETUP — Sellers distributing in a building phase. Negative delta building. Bearish pressure growing.
12. ⚡ BREAKOUT — Price at boundary with strong candle and volume supporting. Imminent breakout expected.
💰 TRADE ADVISOR ENGINE
The Trade Advisor aggregates all signals from the different engines into a single actionable output. It uses a weighted scoring system:
Scoring Weights:
• Scenario Signal: 30%
• Trend Alignment: 20%
• CVD Momentum: 15% + Divergence Bonus
• Pin Forces: 15%
• Liquidity Sweep: 12%
• Stop-Hunt Detection: 10%
• Effort vs Result: 10%
Possible Actions:
• ⏳ WAIT — Edge not strong enough (stay patient)
• 🟢 LONG ENTRY — Buyers have strong advantage + signals align
• 🔴 SHORT ENTRY — Sellers have strong advantage + signals align
• ⚠️ CLOSE LONG/SHORT — Position at risk (reversal/trend flip)
• 🛑 STOP LOSS — Price hit risk threshold
• 💰 TAKE PROFIT — Target threshold reached
📊 EXTENDED INFO PANEL (Detailed Explanations)
The Extended Info panel is hidden by default (toggle: Show Extended Info in settings). It provides detailed metrics that feed into the main engines:
CVD ANALYSIS
What is CVD?
Cumulative Volume Delta (CVD) is the running total of Buy Volume minus Sell Volume. It reveals the underlying buying/selling pressure that may not be visible in price alone.
CVD Value & Slope:
• ↗ Rising: CVD increasing = net buying pressure (bullish)
• ↘ Falling: CVD decreasing = net selling pressure (bearish)
• → Flat: No clear pressure direction
Accumulation vs Distribution:
• Accumulation %: Shows buying pressure strength (0-100). High accumulation with CVD rising = strong bullish bias.
• Distribution %: Shows selling pressure strength (0-100). High distribution with CVD falling = strong bearish bias.
Divergence Alerts:
• ⚠️ BULLISH DIVERGENCE: Price falling but CVD rising. Hidden buying = potential reversal UP.
• ⚠️ BEARISH DIVERGENCE: Price rising but CVD falling. Hidden selling = potential reversal DOWN.
WICK ANALYSIS
Wick Torque:
Torque measures the "rotational force" from wicks. It's calculated from wick length, volume, and body efficiency.
• Positive Torque (Bullish): Bottom wick power dominates. Buyers defended lower prices.
• Negative Torque (Bearish): Top wick power dominates. Sellers defended higher prices.
• ⚡ High Torque (>30): Strong signal, significant wick rejection occurred.
Stop-Hunt Detection:
The engine detects when price has likely swept stop-losses clustered at key levels:
• Stop Hunt Risk %: Likelihood score (0-100). Above 55% = confirmed hunt.
• "Shorts hunted": Price swept below support, liquidating shorts, expect bounce UP.
• "Longs hunted": Price swept above resistance, liquidating longs, expect drop DOWN.
LIQUIDITY SWEEPS
This section appears only when a liquidity sweep is detected. The engine monitors for price sweeping recent highs/lows and then reversing:
• 🎯 LIQUIDITY SWEPT ABOVE: Price broke recent highs but closed back below. Longs trapped, expect DOWN.
• 🎯 LIQUIDITY SWEPT BELOW: Price broke recent lows but closed back above. Shorts trapped, expect UP.
POWER BALANCE
The Power Balance meter shows the real-time strength comparison between buyers and sellers.
Force Ratio:
• 0% = Complete seller dominance
• 50% = Perfect balance
• 100% = Complete buyer dominance
Visual Bar:
• Left side (▓): Bear territory
• Right side (▓): Bull territory
• The bar is smoothed over recent history to reduce noise.
EFFORT vs RESULT
This section measures the efficiency of price movement relative to volume expended.
Energy:
How much volume was spent relative to the average. Energy > 1.0x means above-average volume activity.
Ground:
How much price movement occurred relative to average range. Ground > 1.0x means above-average price movement.
STALL Warning:
A STALL is detected when high energy is spent but low ground is taken (high effort, low result). This often indicates institutional battle, exhaustion, or imminent reversal.
MARKET PHASE
The Phase Engine classifies the current market regime:
RANGE : No clear trend. Price confined to middle of channel. Low ADX. Balanced forces. Trade breakouts with caution.
BUILDING : Compression/preparation phase. Channel tightening or boundary penetration without follow-through. Watch for breakout direction.
TRENDING : Active directional move. Clear slope, good efficiency, price on trending side of channel. Favor pullback entries.
Strength:
0-100% score combining slope, volume validity, and force/efficiency filters.
Bars: How many candles the current phase has persisted.
TRACK RECORD (Validation Panel)
Enable with Show Validation Panel in settings. This section tracks the historical accuracy of scenario predictions:
Accuracy: Percentage of validated predictions that were correct.
Best/Worst Scenario: Shows which scenarios have the highest and lowest accuracy on the current symbol.
Recent Signals: Last 5 predictions with their outcomes. ✓ = correct, ✗ = wrong, ⏳ = pending validation.
⚙️ SETTINGS GUIDE
📊 Volume Analysis
Volume Calculation: Choose Geometry (estimates from candle shape) or Intrabar (precise LTF data).
Intrabar Resolution: LTF for precise mode. Try 1S, 15S, or 1T. Must be lower than chart timeframe.
History Depth: Candles stored in memory (5-50). Higher = more context, slower.
Memory Lookback: Bars for moving averages and Z-scores (10-100).
🏷️ Market Phase
Range Zone Width: How much of channel center is considered "range" (0.1-0.8).
Trend Sensitivity: Minimum slope to detect trending. Lower = more sensitive.
Min Episode Length: Minimum bars before phase can change. Prevents flickering.
🎯 Scenarios
Min Confidence to Show: Only display scenarios above this confidence level (30-90).
Bars to Validate: How many bars to wait before checking if prediction was correct.
Success Move %: Minimum price movement to consider prediction successful.
💰 Trade Advisor
Min Confidence for Entry: Minimum confidence to suggest a trade entry (50-90).
Default Risk %: Stop loss distance as % of price (0.5-5.0).
Min Risk/Reward: Minimum acceptable R:R ratio (1.0-5.0).
🔔 ALERT CONDITIONS
The indicator provides the following alert conditions you can configure:
• 🟢 LONG Entry Signal
• 🔴 SHORT Entry Signal
• ⚠️ Close LONG Signal
• ⚠️ Close SHORT Signal
• 🛑 STOP LOSS Alert
• 💰 Take Profit Alert
• 🚨 High Urgency Signal
⚠️ IMPORTANT DISCLAIMER
EDUCATIONAL TOOL ONLY
This indicator is designed for educational purposes to help users identify different market scenarios and understand how various signals might be interpreted.
The Trade Advisor is NOT a recommendation to buy, sell, or invest.
• Past performance does not guarantee future results
• All trading involves risk of loss
• The creator is not a licensed financial advisor
• Always do your own research (DYOR)
• Consult a qualified financial advisor before making any investment decisions
By using this indicator, you acknowledge that you understand these risks and accept full responsibility for your trading decisions.

SMA Strategy [MK]Overview
This strategy is a momentum-based trend-following system designed to capture sustained market moves while minimizing "whipsaws" often found in sideways markets. It utilizes a dual-SMA filter for trend direction, a precise price-crossover trigger for entry, and the Average Directional Index (ADX) to gauge market strength.
How It Works
The strategy follows a strict "Trend + Momentum + Strength" hierarchy:
1. Trend Identification (The Filter) The script uses a Fast SMA (20) and a Slow SMA (50).
Long Bias: SMA-20 > SMA-50.
Short Bias: SMA-20 < SMA-50.
2. Precise Entry (The Trigger) Unlike strategies that enter simply because the price is above a line, this script requires a Price Crossover.
Long Entry: Price must actively cross from below to above the SMA-20.
Short Entry: Price must actively cross from above to below the SMA-20.
3. Trend Strength (The ADX Gatekeeper) To solve the problem of sideways markets where moving averages run parallel, we’ve integrated the ADX (Average Directional Index). The strategy will only trigger a trade if the ADX is above a user-defined threshold (default is 25), ensuring we only enter when the market is trending.
4. RSI Safety Filter To prevent "buying the top" or "selling the bottom," the RSI checks for overextended conditions. It prevents long entries if the RSI is already overbought and short entries if it is oversold.
Exit Logic
The strategy features three layers of protection:
Trend Reversal Exit: Closes the position if the price crosses back over the SMA-20 while the macro trend (SMA-20/SMA-50) has flipped.
Fixed Take Profit: A percentage-based target to lock in gains during sharp moves.
Fixed Stop Loss: A percentage-based safety net to protect capital.
Key Features
Directional Selector: Choose between "Long Only," "Short Only," or "Both."
Visual Feedback: Background colors highlight "Trending" (Green) vs "Sideways" (Red) market regimes.
Fully Customizable: All lengths and thresholds for SMAs, RSI, and ADX can be adjusted to fit different assets and timeframes.
Instructions for Use
Timeframe: This strategy is optimized for trending timeframes such as the 1-Hour (1H), 4-Hour (4H), or Daily (D). Using it on very low timeframes (1-minute or 5-minute) may increase the number of false signals due to market noise.
Asset Classes: Best suited for high-volume assets like Major Forex Pairs, Large-Cap Stocks, and Blue-Chip Cryptocurrencies.
Parameter Tuning: Use the "Strategy Tester" to find the ideal ADX Threshold for your specific asset. Volatile assets usually require a higher ADX (30+) to filter out fake breakouts.
Disclaimer
Financial Risk Warning: The script provided is for educational and informational purposes only. Trading involves significant risk, and there is always the potential for loss. Past performance, whether simulated or real, is not a guarantee of future results.
The author of this script is not a financial advisor. This indicator is not a signal service or a recommendation to buy or sell any security. Always perform your own due diligence and test any strategy thoroughly on a demo account before risking live capital. By using this script, you acknowledge that you are solely responsible for your trading decisions and any resulting financial outcomes.

Hamazaki-Style Scalping SystemOverview: hmzk-Style Scalping System
This system is designed to identify high-probability entries in the 1-minute time frame while strictly filtering out low-efficiency market noise. It focuses on the concept of "Gensen" (Strict Selection)—only trading when volatility and trend alignment provide a clear statistical edge.
1. Visual Filtering (Background Colors)
The system uses background colors to provide instant environmental awareness:
Green Zone (High Probability):
Condition: ATR is above the 1.5-pip threshold and the price is diverging from the Kernel line.
Meaning: High volatility and momentum are present. This is the optimal "War Zone" for scalping.
Gray Zone (Avoidance):
Condition: Price is overlapping with the Kernel line.
Meaning: A "sideways" or "ranging" market. hmzk labels this as the "Death Point" where traders lose money due to spreads and lack of direction.
2. Technical Components
Calix Kernel Regression (h=21, r=34, x_0=55):
Serves as the primary trend filter. When the line is horizontal and price is tangled with it, stay out.
When the line slants and price moves away ("Gator opening"), follow the trend.
ATR Break-Out (1.5 Pips Threshold):
Ensures there is enough "meat" in the move to cover spreads and generate profit.
Fractal Arrows (▲/▼):
Indicates potential turning points or breakout levels. These are most effective when they appear in a Green Zone.
3. Execution & Discipline
The 40-Trade Rule: Limit yourself to roughly 40 high-quality trades per day to avoid overtrading and maintain focus.
0.4-Second Stop Loss: If the price action does not immediately follow your hypothesis, exit within a fraction of a second to minimize "expenses" (losses).
Pattern Over Instinct: Only enter when your predefined "form" or "pattern" appears. hmzk teaches that "waiting is the ultimate skill".
Market Context: Prioritize trades during high-liquidity windows like the London/NY open or specific time transitions (e.g., the 24:00 winter time shift).

Fibonacci 5 Candles Retracement
================================================================================
FIBONACCI 5 CANDLES RETRACEMENT - STRATEGY GUIDE
================================================================================
WHAT DOES THIS STRATEGY DO?
---------------------------
This strategy automatically identifies market trends and uses Fibonacci
retracements to find the best entry points. The idea is simple: when price
makes a strong movement (trend), it often pulls back before continuing in
the same direction. The strategy captures these "pullbacks" to enter at the
right moment.
HOW IT WORKS?
-------------
1. TREND DETECTION
The strategy looks for 5 consecutive candles of the same color:
- 5 red candles = BEARISH trend (price falls)
- 5 green candles = BULLISH trend (price rises)
2. CALCULATION OF START AND END POINTS
For a BEARISH trend (5 red candles):
- START: The highest point between the first red candle and the previous one
- END: The lowest point reached during the 5 candles (and beyond, if the
trend continues)
For a BULLISH trend (5 green candles):
- START: The lowest point between the first green candle and the previous one
- END: The highest point reached during the 5 candles (and beyond, if the
trend continues)
3. DYNAMIC UPDATE
The END point updates automatically if price continues to move in the
direction of the trend, creating new highs (for bullish trends) or new
lows (for bearish trends).
4. TREND END
Normal Mode:
- BEARISH trend ends when a candle closes above the previous candle's open
- BULLISH trend ends when a candle closes below the previous candle's open
"Extended Trend" mode (optional):
- The trend remains active until a candle closes beyond the dynamic 50%
retracement level
- When this happens, the END point "freezes" (stops updating), but the
trend can continue
5. FIBONACCI RETRACEMENT CALCULATION
Once START and END are identified, the strategy automatically calculates
Fibonacci levels. IMPORTANT: for retracements and pending orders, we
consider START as 100% and END as 0%, because we work on the part of the
trend that is recovered (the pullback).
The retracement levels are:
- 70% = level closest to START (smallest retracement)
- 60% = second level
- 50% = central level (often used for entry)
- 25% = level closest to END (largest retracement)
6. PENDING ORDER PLACEMENT
When a trend is identified and completed, the strategy automatically places
a pending order (limit order) at one of the selectable Fibonacci levels.
Available levels:
- 25%: closest to END
- 50%: central level (balanced)
- 60%: closest to START
- 70%: very close to START
The order direction depends on the trend:
- BEARISH trend → SHORT order (bet that price falls)
- BULLISH trend → LONG order (bet that price rises)
Stop Loss and Take Profit (for retracements):
- Stop Loss: always at START level
- Take Profit: always at END level
EXTENDED TAKE PROFIT:
If the order is executed (filled), the strategy can apply an "Extended
Take Profit" if configured. IMPORTANT: for the extended TP calculation,
we consider START as 0% and END as 100% (the original trend movement).
For example, if you set 3%, the Take Profit will be at 103% of the
original trend movement instead of 100%.
AVAILABLE FILTERS
-----------------
1. MINIMUM TREND (pips)
Filters trends that are too small. If a trend is below the set value:
- START and END labels become gray (instead of red/green)
- No pending order is placed
- The trend is still displayed on the chart
Useful for avoiding trading movements that are too small.
2. EMA FILTER
Uses two moving averages (EMA 50 and EMA 200) to filter direction:
- If active: places LONG orders only when EMA50 > EMA200 (uptrend)
- If active: places SHORT orders only when EMA50 < EMA200 (downtrend)
Useful for trading only in the direction of the main trend.
3. EXTENDED TREND
Modifies how the trend is considered "completed":
- If disabled: uses normal logic (opposite candle)
- If active: the trend remains in formation until a candle closes beyond
the dynamic 50%. When this happens, END freezes but the trend can continue.
Useful for capturing longer trends and extended movements.
VISUALIZATION
-------------
The strategy displays on the chart:
1. START AND END LABELS
- Red color for bearish trends
- Green color for bullish trends
- Gray color if the trend is not valid (too small)
- Remain visible even when new trends form
2. START AND END LINES
- Horizontal lines indicating the start (START) and end (END) points of the trend
- White color by default, customizable from the settings panel
- Update dynamically when the END point changes
- Can be shown or hidden via the "Show Start/End Lines" option
3. FIBONACCI LINES
The strategy shows horizontal lines at retracement levels:
- Line at 50% (yellow by default)
- Line at 25% (green by default)
- Line at 60% (azure by default)
- Line at 70% (red by default)
COLOR CUSTOMIZATION:
All line colors can be customized from the settings panel in the
"LINE COLORS" section:
- Start/End Line Color: customize the color of START and END lines
- 50% Line Color: customize the color of the 50% line
- 25% Line Color: customize the color of the 25% line
- 60% Line Color: customize the color of the 60% line
- 70% Line Color: customize the color of the 70% line
Lines update dynamically when the END point changes and can be shown or
hidden individually via options in the "VISUALIZATION" section.
4. PENDING ORDER LABELS
Show pending order information:
- Direction (LONG or SHORT)
- Entry price
- Stop Loss
- Take Profit
Positioned far from the chart to avoid cluttering the visualization.
ALERTS
------
If enabled, alerts send notifications when:
1. PENDING ORDER CREATED
When a new pending order is placed, with all information.
2. PENDING ORDER UPDATED
When the pending order is updated (for example, if the level changes or
if the END point moves).
3. ORDER OPENED
When the pending order is executed (filled) and the position is opened.
Alerts can be configured in TradingView to send notifications via email,
SMS, or other platforms.
RECOMMENDED SETTINGS
--------------------
To get started, you can use these settings:
VISUALIZATION:
- Show all lines and labels to see how it works
- Show Start/End Lines: true (to display lines at START and END points)
- Customize line colors in the "LINE COLORS" section according to your preferences
STRATEGY:
- Pending Order Level: 50% (balanced)
- Extended TP: 0% (use standard TP at 100%)
FILTERS:
- Minimum Trend: 0 pips (disabled initially)
- Use EMA Filter: false (disabled initially)
- Extended Trend: false (use normal logic)
ALERTS:
- Enable Alerts: true (if you want to receive notifications)
PRACTICAL EXAMPLE
-----------------
Scenario: Bearish Trend
1. Price forms 5 consecutive red candles
2. The strategy identifies:
- START = 1.2000 (highest point)
- END = 1.1900 (lowest point)
- Range = 100 pips
3. Calculates Fibonacci levels (for retracements: START = 100%, END = 0%):
- 100% = 1.2000 (START)
- 70% = 1.1930
- 60% = 1.1940
- 50% = 1.1950
- 25% = 1.1975
- 0% = 1.1900 (END)
4. If you set "Pending Order Level" to 50%:
- Places a SHORT pending order at 1.1950 (50% retracement)
- Stop Loss at 1.2000 (START = 100%)
- Take Profit at 1.1900 (END = 0%)
5. If price rises and touches 1.1950:
- The order is executed
- Opens a SHORT position
- If price falls to 1.1900 → Take Profit (profit)
- If price rises to 1.2000 → Stop Loss (loss)
IMPORTANT NOTE
--------------
This strategy is a technical analysis tool. Like all trading strategies,
it does not guarantee profits. Trading involves risks and you can lose money.
Always use appropriate risk management and test the strategy on historical
data before using it with real money.
LICENSE
-------
This code is open source and available for modification. You are free to
use, modify, and distribute this strategy. If you republish or share a
modified version, please kindly mention the original author.
================================================================================

Rate Trail IndicatorRate Trail Indicator Precision Trailing Stop & Multi-Timeframe Highs
Description The Rate Trail Indicator V2 is a professional-grade risk management tool designed to declutter your charts while providing precise, dynamic stop-loss levels. Unlike traditional indicators that paint a continuous "trail" or history across the chart, this script utilizes a Single Line visual approach. It draws only the currently active stop-loss level as a distinct horizontal line, keeping your workspace clean and focused on current price action.
This updated version now includes extensive Multi-Timeframe (MTF) Support, allowing you to overlay key Intraday and Higher Timeframe (HTF) highs directly on your chart.
Key Features Clean "Single Line" Visuals: Removes historical noise by plotting only the active stop-loss level and a dedicated price label. Dual Logic Modes: Percentage Mode: Classic trailing stop based on a percentage drop from the high. Renko Mode: Volatility-based stop that counts exact "Bricks" (supports decimals like 1.5 bricks). Dynamic Reset: The stop trails the "Lifetime High" of the current trend. If the stop is breached, it automatically resets to the current price to begin a new trail immediately. MTF High Breakout Levels: Optional toggles to display previous Intraday Highs (2H, 4H, 6H, 12H) and Historical Highs (1W, 2W, 1M, 3M). Rolling 3-Month Logic: The 3M level now uses a "Rolling" lookback (Highest of the last 3 monthly candles) rather than a fixed calendar quarter, ensuring the data is always recent and relevant. Full Customization: Control line styles (Solid, Dashed, Dotted), colors, and widths for every level independently via the inputs.
How to Use & Settings
1. Main Trailing Stop Setup Configure your primary risk line (Red Line) in the "Main Trailing Stop" group. Stop-Loss Mode: Select Percentage for standard equity/crypto trading (e.g., 2% trail) or Renko Boxes for Renko charts. Renko Boxes Down: Enter the number of bricks to trail. You can use decimals (e.g., 1.5) for fine-tuning. Use Fixed Lookback?: Unchecked (Default): The script tracks the "Infinite High" since the last reset. This is ideal for catching long trends. Checked: The script only looks at the highest price of the last X bars. This creates a more "rolling" stop-loss.
2. Intraday & Historical Highs (Resistance/Breakout) Enable up to eight additional lines to see where the price peaked on other timeframes. These act as strong breakout or resistance levels. Intraday Highs: Show the high of the previous 2H, 4H, 6H, or 12H session. 1W / 1M Highs: The highest price of the previous Week or Month. 2W High: The highest price of the last 2 Weeks . 3M High (Updated): The highest price of the last 3 Months (Rolling). This updates monthly, ensuring you aren't looking at data that is 6 months old.
3. Alerts You can set specific alerts to automate your trading or get notified instantly. Main Stop Breached: Fires when price closes below your trailing stop line. MTF High Cross: Fires when price crosses under any of the enabled Intraday or HTF High levels (2H, 4H, 1W, 3M, etc.).

Swing Trade System# Swing Trade Strategy - Complete Guide
## Overview
This is a comprehensive swing trading indicator for TradingView that identifies high-probability trend continuation setups using multi-timeframe analysis, pullback patterns, and momentum confirmation. The strategy combines technical indicators with risk management tools to help traders capture swing moves with defined risk-reward parameters.
## What It Does
The indicator identifies two types of signals:
1. **Base Signals** (small markers) - Initial setup detection with basic criteria met
2. **High Confidence (HC) Signals** (large markers) - Fully confirmed setups with all filters passed, including optional higher timeframe confirmation
Once a HC signal triggers, the indicator automatically plots:
- Dynamic stop loss levels (trailing, break-even, or static)
- Partial take profit (TP1) at 1R
- Final take profit (TP2) at your chosen risk-reward multiple
- Real-time R-multiple tracking
- Confluence dashboard showing all conditions
## How It Works
### Core Signal Logic
The strategy identifies pullback-to-trend entries using this sequence:
**For LONG signals:**
1. **Trend Filter**: Fast EMA (20) above Slow EMA (50) = uptrend confirmed
2. **Pullback**: Previous candle closed between the two EMAs (pulled back but didn't break structure)
3. **RSI Swing Zone**: RSI between 40-60 (not overbought/oversold, just resting)
4. **Reclaim**: Current candle crosses back above Fast EMA (momentum returning)
5. **Volume Spike** (optional): Current volume > 1.5x the 20-period average
6. **HTF Confirmation** (optional): Daily timeframe shows: price > 50 EMA, RSI > 50, and rising momentum
**For SHORT signals:**
The same logic applies in reverse (downtrend, pullback above fast EMA, reclaim below, etc.)
### Risk Management Features
**Stop Loss Placement:**
- Initial stop: Swing low/high over the last 10 bars
- Can upgrade to ATR trailing stop (2x ATR below/above price)
- Can move to break-even after reaching 1R profit
**Take Profit Levels:**
- TP1: 1R (optional partial exit point)
- TP2: 2R default (adjustable to your preference)
**Position Monitoring:**
- Live R-multiple display shows current profit/loss in risk units
- Dynamic stop updates visually on chart
- Color-coded confidence score (0-100%) based on confluence of factors
## Best Way to Use These Signals
### 1. **Wait for High Confidence Signals Only**
- Don't trade every base signal (small markers)
- Only take trades when you see the large "HC L" or "HC S" markers
- These have passed all your filters including higher timeframe alignment
### 2. **Ideal Entry Timing**
**On the Signal Candle:**
- Enter at market close when HC signal fires
- This ensures all conditions were met by candle close
- Your stop and targets are calculated from this close price
**On the Next Candle (more conservative):**
- Wait for the candle after the signal
- Enter if price continues in the signal direction
- Helps avoid false breakouts but may miss some moves
### 3. **Position Sizing**
Use the automatic risk calculation:
- Your risk = Entry price - Stop loss
- Position size = (Account Risk %) ÷ (Entry - Stop)
- Example: Risk $100 on account, Entry $50, Stop $48 = $100 ÷ $2 = 50 shares
### 4. **Trade Management**
**Scaling Out:**
- Exit 50% position at TP1 (1R) to lock profits
- Move stop to break-even on remaining position
- Let rest run to TP2 (2R) or trail with ATR stop
**Manual Override:**
- If price action deteriorates (breaks below both EMAs, RSI divergence), consider early exit
- The dynamic stop is a guide, not gospel—trust price action
## Breakout vs. Retest Strategy
### Understanding Breakout Types
**1. First Touch Breakout (Aggressive)**
- HC signal fires on first touch of fast EMA after pullback
- Higher win rate if volume is strong
- Best in strongly trending markets
- Risk: Could be a false breakout if momentum weak
**2. Retest Entry (Conservative)**
- Wait for price to pull back *again* after initial HC signal
- Enter when price retests the fast EMA a second time
- Look for: lower volume on retest, RSI still in swing zone, fast EMA still above slow EMA
- Lower risk but may miss some fast moves
### Which Breakouts to Take
**Take the FIRST breakout (signal candle) when:**
- ✅ Higher timeframe is strongly aligned (HTF confirmation on)
- ✅ Volume spike is present (>1.5x average)
- ✅ Confidence score ≥70%
- ✅ Trend is fresh (EMAs recently crossed, not extended)
- ✅ Price closed strongly above/below fast EMA (not barely crossed)
- ✅ No major resistance/support nearby
**Wait for a RETEST when:**
- ⚠️ No volume confirmation on first signal
- ⚠️ Confidence score 40-69% (moderate)
- ⚠️ Price barely crossed the fast EMA (weak momentum)
- ⚠️ Trend is extended (price far from slow EMA)
- ⚠️ Major resistance/support level just ahead
- ⚠️ Late in the trading day/week (could see pullback)
### How to Trade Retests
**Setup:**
1. HC signal fires but you decide to wait
2. Price pulls back toward fast EMA over next 1-3 candles
3. Watch for second bounce at the fast EMA
**Confirmation for Retest Entry:**
- Price holds above fast EMA (for longs) without closing below it
- Volume decreases on the pullback (profit-taking, not reversal)
- RSI stays above 50 for longs (or below 50 for shorts)
- Bullish candlestick pattern forms (hammer, engulfing, etc.)
- Slow EMA is still providing support/resistance
**Retest Entry Trigger:**
- Enter when price crosses back in signal direction with momentum
- Or enter with a limit order at the fast EMA
- Use same stop loss as original signal (swing low/high)
- Targets remain the same (measured from your new entry)
## Dashboard Reference
The top confluence table shows real-time status:
- **Trend**: Current trend direction based on EMAs
- **HTF**: Higher timeframe alignment (if enabled)
- **RSI Zone**: Whether RSI is in the 40-60 swing zone
- **Volume**: Volume spike present or not
- **Signal**: Current signal status (HC LONG/SHORT or None)
- **R Risk**: Current profit/loss in R-multiples
- **Stop**: Current stop loss price
- **TP1/TP2**: Status of take profit levels
- **Conf %**: Overall confidence score (70%+ = high probability)
## Alert Setup
The indicator includes 8 alert types:
1. **HC LONG/SHORT ENTRY** - Main trade signals
2. **LONG/SHORT TP1 Reached** - Partial profit alerts
3. **LONG/SHORT Final TP Reached** - Full target hit
4. **LONG/SHORT Stop Hit** - Exit alerts
Set up alerts in TradingView:
- Click "Create Alert" on the indicator
- Choose the specific alert condition
- Set to "Once Per Bar Close" to avoid false alerts
- Configure notification method (app, email, webhook, etc.)
## Recommended Settings
**For Stock Swing Trading (4H-Daily):**
- Fast EMA: 20 | Slow EMA: 50
- Swing Lookback: 10
- RSI Zone: 40-60
- HTF: Daily (if trading 4H charts)
- Risk-Reward: 2R minimum
**For Crypto (faster moves):**
- Fast EMA: 12 | Slow EMA: 26
- Swing Lookback: 7
- RSI Zone: 35-65
- Volume Spike: ON
- Risk-Reward: 1.5-2R
**For Conservative Trading:**
- Enable HTF Confirmation
- Enable Volume Spike requirement
- Use Break-even stop (move after 1R)
- Only trade when Confidence ≥70%
- Wait for retests on marginal setups
## Risk Warning
This indicator is a tool, not a guarantee. Always:
- Use proper position sizing (risk 1-2% per trade)
- Respect the stop losses
- Consider market context (news, earnings, major levels)
- Backtest on your instruments before live trading
- Never override risk management for FOMO
The best signals combine technical confluence with good market conditions and disciplined execution.
